Daily Voice : IT शेयरों में हालिया तेजी भले ही अभी किसी टिकाऊ रिकवरी का संकेत न हो,लेकिन हर उछाल पर आईटी शेयरों में बिकवाली की एकतरफा रणनीति अपनाना भी जल्दबाजी हो सकती है। अमेरिकी मध्यावधि चुनावों के नतीजे बाजारों के लिए एक ट्रिगर का काम कर सकते हैं,लेकिन इस बात की संभावना कम है कि केवल इसी वजह से बाजार में कोई बड़ी तेजी या कच्चे तेल में भारी गिरावट आएगी। ये बातें अल्फएक्यूरेट एडवाइजर्स के प्रबंध निदेशक और संस्थापक राजेश कोठारी ने मनीकंट्रोल से हुई एक बातचीत में कही हैं।
उन्होंने आगे कहा कि आईटी शेयरों में आई हालिया तेजी पॉजिटिव संकेत है लेकिन निवेशकों को अभी यह नहीं मान लेना चाहिए कि इस सेक्टर में टिकाऊ तेजी की शुरुआत हो गई है। पोर्टफोलियो में कोई बदलाव करने से पहले तेल सप्लाई की स्थिति,डॉलर,बॉन्ड यील्ड और कॉर्पोरेट अर्निंग पर नजर रखने की जरूरत है।
आईटी में तीन बातों पर नजर रखने की जरूरत
राजेश कोठारी के मुताबिक IT शेयरों में हालिया तेजी उत्साहजनक है,लेकिन इसे एक टिकाऊ तेजी मान लेने में सावधानी बरतने की जरूरत है। बड़ा सवाल यह है कि क्या यह तेजी इंडस्ट्री की अर्निंग आउटलुक से मेल खाती है या यह सिर्फ ‘ओवरसोल्ड’लेवल्स से आई खरीदारी है? हमें आईटी में तीन बातों पर नजर रखने की जरूरत है:
मांग की स्थिति: विशेष रूप से अमेरिका और यूरोप में टाले जा सकने वाला टेक्नोलॉजी खर्च (discretionary technology spending)अहम बना हुआ है। बेहतर सौदे हासिल करने का नतीजा रेवेन्यू ग्रोथ के रूप में दिखना चाहिए।
AI से बदलाव और अवसर: AI कमाई के नए स्रोत पैदा कर सकता है, लेकिन यह पारंपरिक बिलिंग मॉडल को भी बदल सकता है और कीमतों पर दबाव डाल सकता है।
वैल्यूएशन और अर्निंग आउटलुक: भारी तेजी के बाद, जिन शेयरों की कीमत उनकी कमाई की संभावनाओं से आगे निकल गई है, उनमें मुनाफावसूली (प्रॉफिट-टेकिंग) देखने को मिल सकती है।
राजेश कोठारी का मानना है कि आईटी सेक्टर में तेजी आने पर हर शेयर बेच देने की रणनीति जल्दबाजी हो सकती है, लेकिन इस तेजी के पीछे भागना भी कोई समझदारी नहीं है। आईटी में उन कंपनियों को ही प्राथमिकता देनी चाहिए जिनकी ग्रोथ की संभावनाएं बेहतर हो रही हैं, जिनके ग्राहकों के साथ मजबूत संबंध हैं और जिनके पास AI से कमाई करने के ठोस मौके हैं। ऐसी कंपनियों से दूर रहने की जरूरत है जो अभी भी कमजोर मांग से जूझ रही हैं।
क्या आप कंजम्पशन सेक्टर को लेकर सतर्क हैं? कंजम्पशन डिमांड और इससे जुड़े शेयरों पर आपकी क्या राय है?
राजेश कोठारी ने कहा कि कंजम्पशन सेक्टर को लेकर पूरी तरह सतर्क रहने के बजाय,चुनिंदा रुख अपनाना पसंद करेंगे। जरूरी चीजों पर होने वाले खर्च और गैर-जरूरी (वैकल्पिक) चीजों पर होने वाले खर्च के बीच का अंतर समझना जरूरी है। कई ‘फास्ट फ्रीक्वेंसी’ डेटा इंडिकेटर कंजम्पशन ट्रेंड में सुधार दिखा रहे हैं (जैसे रिटेल क्रेडिट ग्रोथ, टू-व्हीलर की बिक्री में बढ़ोतरी, आदि)।
इस सेक्टर में ऐसी कंपनियों पर नजर रखनी चाहिए जिनके पास मजबूत ब्रांड, अच्छा डिस्ट्रीब्यूशन नेटवर्क, कीमतों को तय करने की ताकत, अच्छी बैलेंस शीट और सही वैल्यूएशन हों। वैकल्पिक उपभोग (discretionary consumption) के सेक्टर में केवल कीमतों में बढ़ोतरी पर निर्भर रहने के बजाय, बिक्री की मात्रा (volume) में बढ़त के संकेतों पर भी नजर रखने की जरूरत है।
क्या आप आने वाले समय में ‘अल नीनो’ (El Niño) को बड़ा जोखिम मानते हैं? इसका महंगाई, ग्रामीण मांग और भारत के विकास पर क्या असर पड़ सकता है?
इसके जवाब उन्होंने कहा कि ‘अल नीनो’ एक जोखिम तो है,लेकिन इसे देखकर यह मान लेना सही नहीं होगा कि भारत के विकास का पूरा आउटलुक ही खराब हो जाएगा। कोई निष्कर्ष निकालने से पहले फसल उत्पादन, जलाशयों के जल-स्तर, खाने-पीने की चीजों की कीमतों के रुझान और ग्रामीण मांग के इंडीकेटरों पर नजर रखने की जरूरत है।
Q2FY27 में बैंकों के नतीजे कैसे रह सकते है? क्या इनके मौजूदा वैल्यूएशन अच्छे लग रहे है या इन स्तरों से आगे बढ़ने की गुंजाइश सीमित है?
इसके जवाब में राजेश कोठारी ने कहा कि बैंक शेयरों का प्रदर्शन उत्साहजनक है। ज़्यादातर बैंकों ने लोन वितरण (डिस्बर्समेंट) में अच्छी बढ़ोतरी और मज़बूत एसेट क्वालिटी की जानकारी दी है। अच्छे बैंकों में मध्यम अवधि के नजरिए निवेश के अच्छे मौके दिख रहे हैं लेकिन वैल्यूएशन के नजरिए से चुनिंदा शेयरों पर ही दांव लगाने की सलाह होगी।
ऐसे बैंकों पर फोकस करने की सलाह होगी जिनकी अर्निंग ग्रोथ को टिकाऊ कोर इनकम,अच्छी एसेट क्वालिटी और मजबूत फंडिंग फ्रेंचाइजी का सपोर्ट हासिल हो। अगले दो से तीन तिमाहियों में मार्जिन में सुधार की स्थिति कैसी रहती है, इस पर भी नजर रहनी चाहिए।
डिस्क्लेमर: मनीकंट्रोल.कॉम पर दिए गए विचार एक्सपर्ट के अपने निजी विचार होते हैं। वेबसाइट या मैनेजमेंट इसके लिए उत्तरदाई नहीं है। यूजर्स को मनी कंट्रोल की सलाह है कि कोई भी निवेश निर्णय लेने से पहले सर्टिफाइड एक्सपर्ट की सलाह लें।
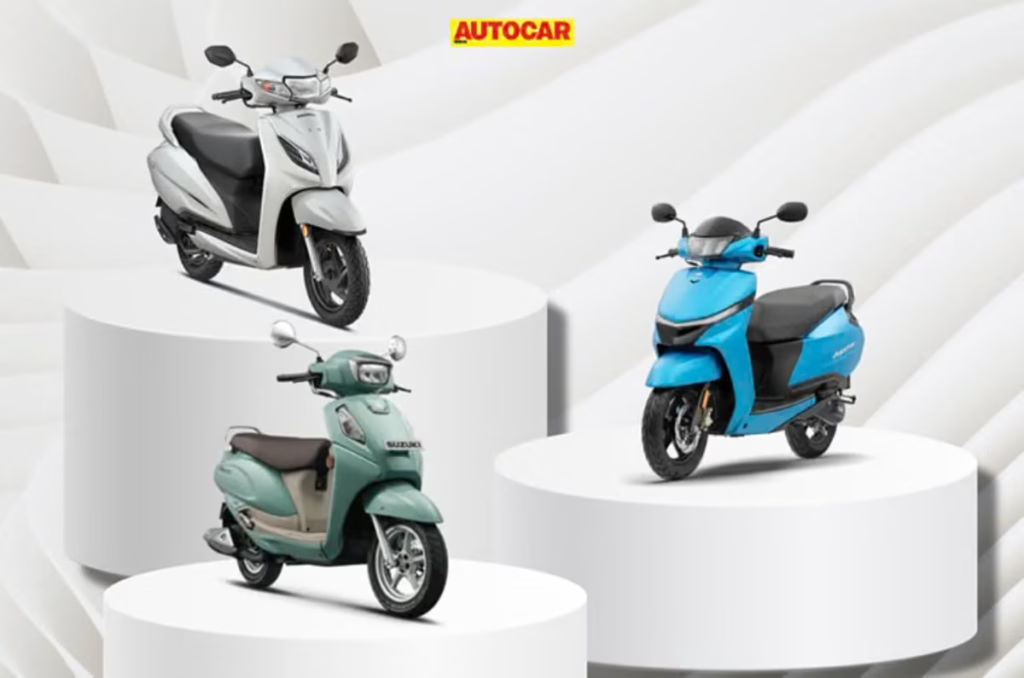
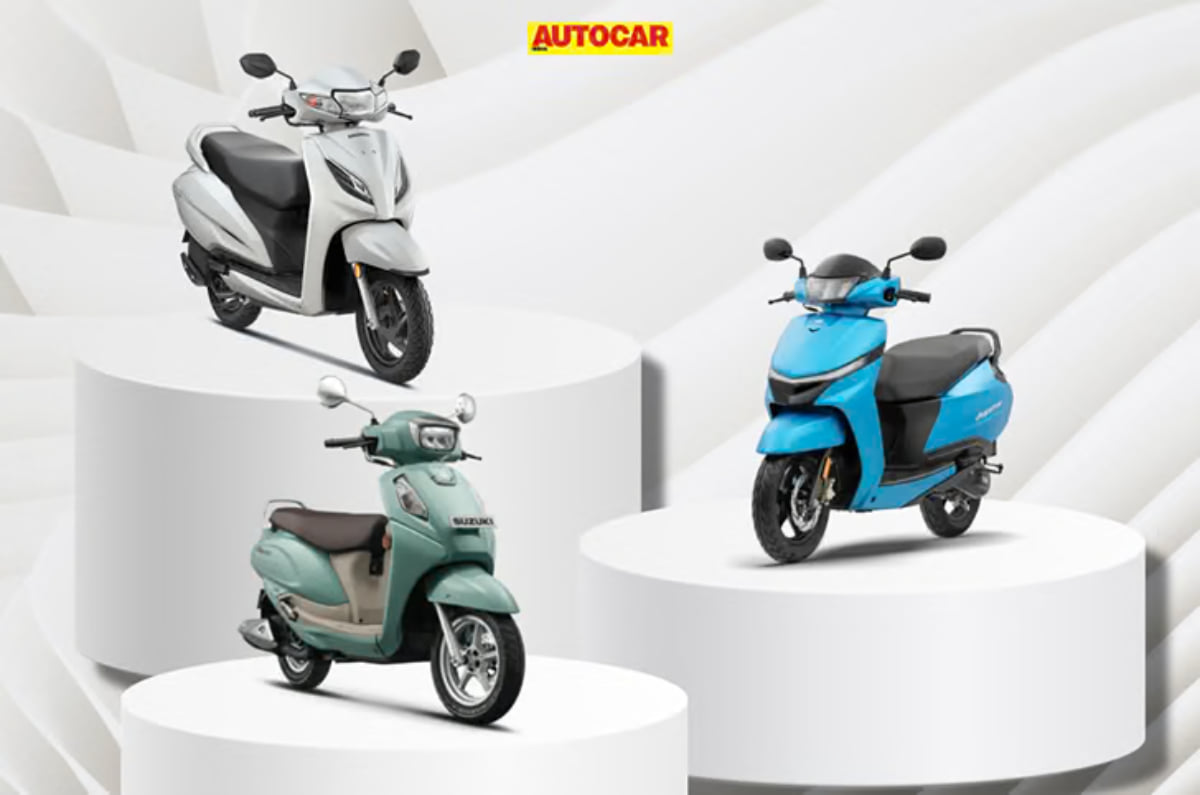
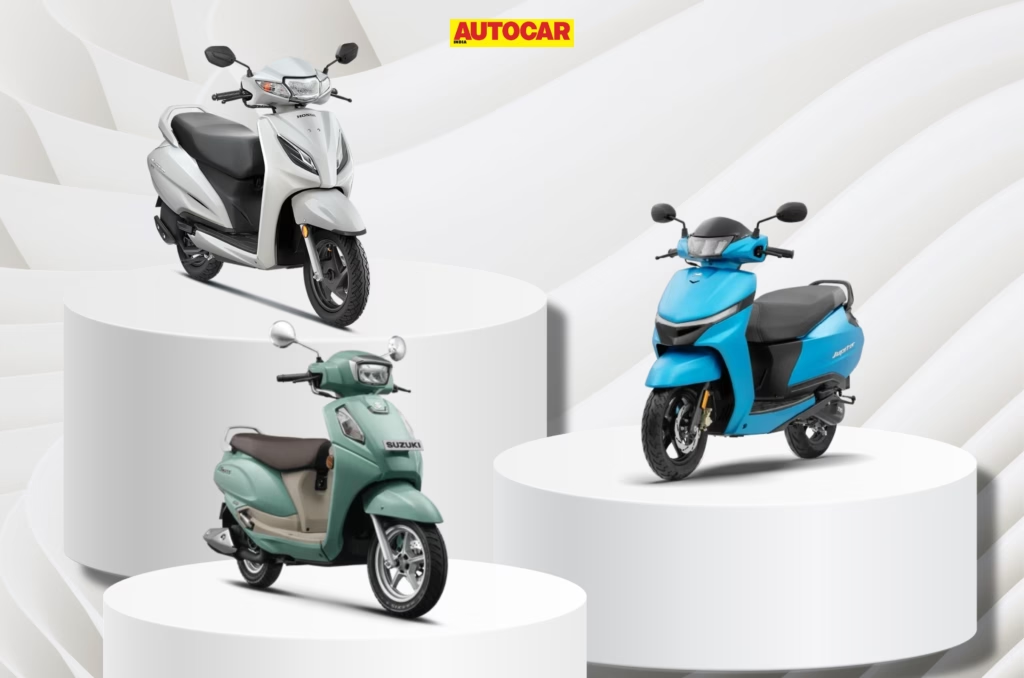
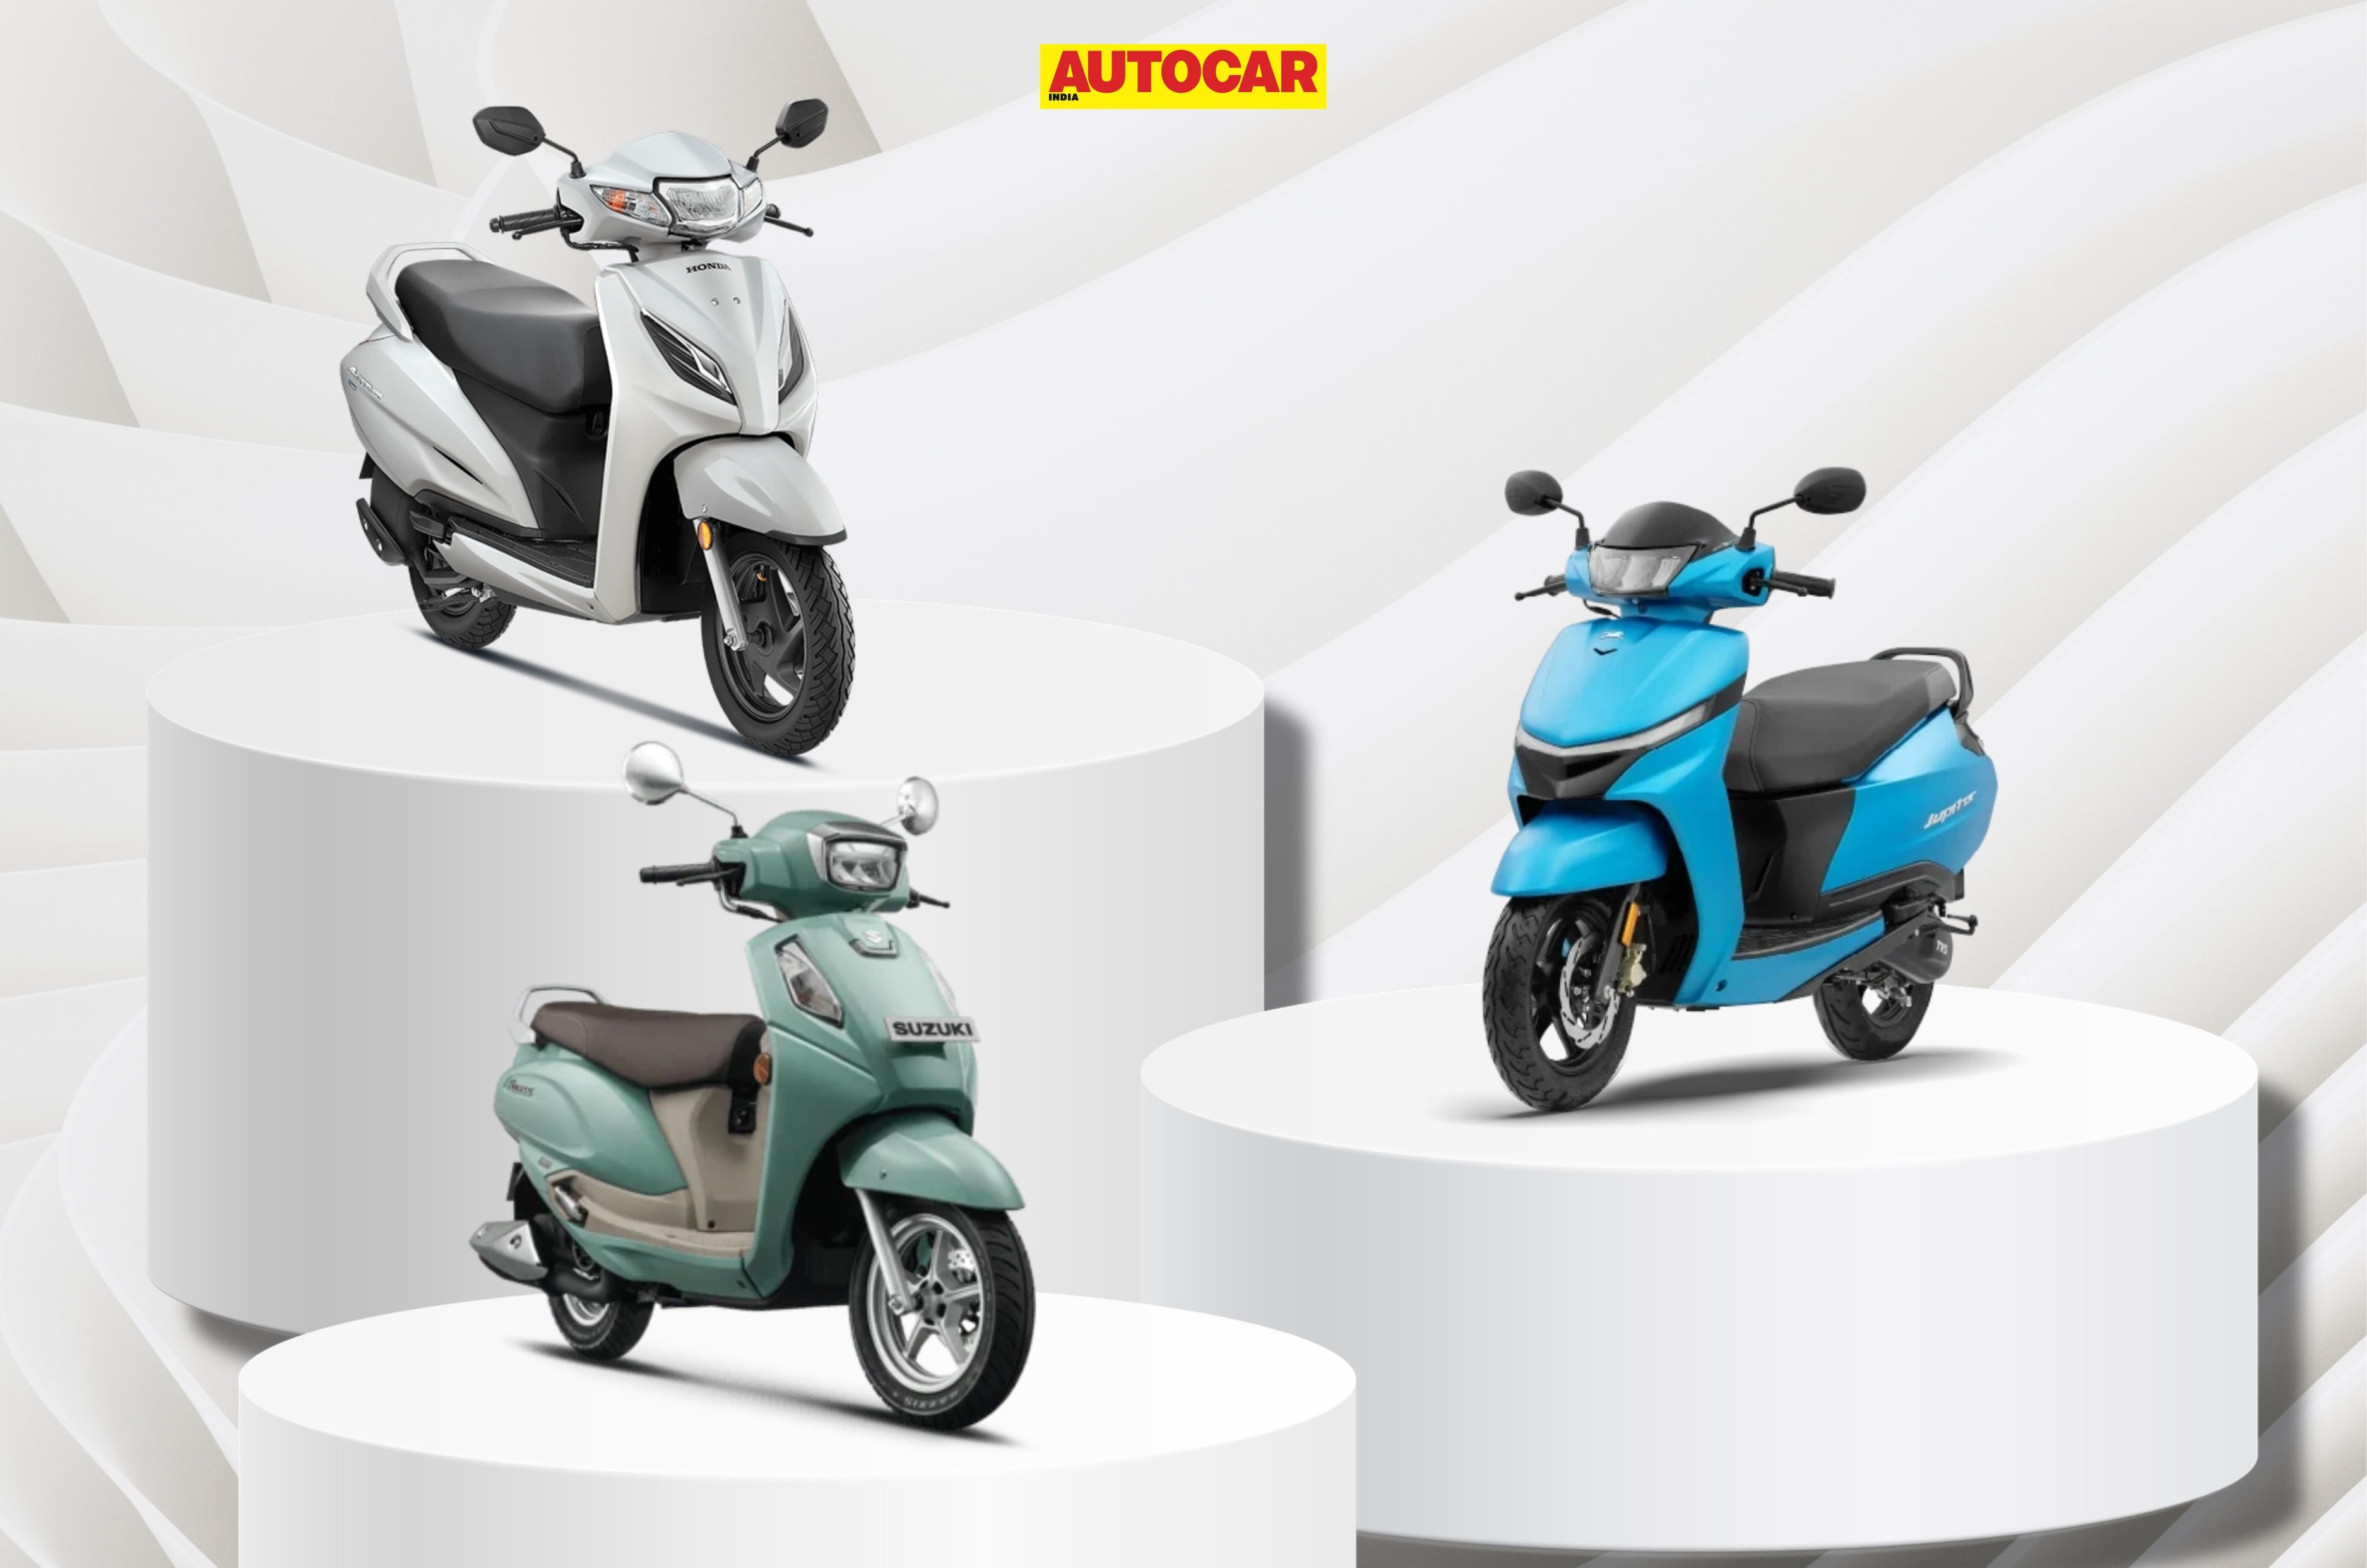
Two-wheeler manufacturers have dispatched a record 48,65,192 scooters in the domestic market in the first half (H1) of FY2027. That’s an additional 10.8 lakh units over the same period last year, representing a 29 percent increase. The six-month period included two monthly records: April 2026 opened as the best-ever April, with 6,91,993 units, while September registered 9,95,576 units – the highest monthly total ever for the category and just 4,424 units short of the million-unit (10 lakh) milestone.
Zooming out, the scale of the growth becomes clearer. Scooter sales have more than doubled over 12 years. In H1 FY2016, the total was 2.4 million units, whereas FY2027’s first half has already reached about 60 percent of FY2026’s full-year record of 8.11 million units.
Electric scooters double, claim a 20 percent share
Honda leads overall, TVS grows faster
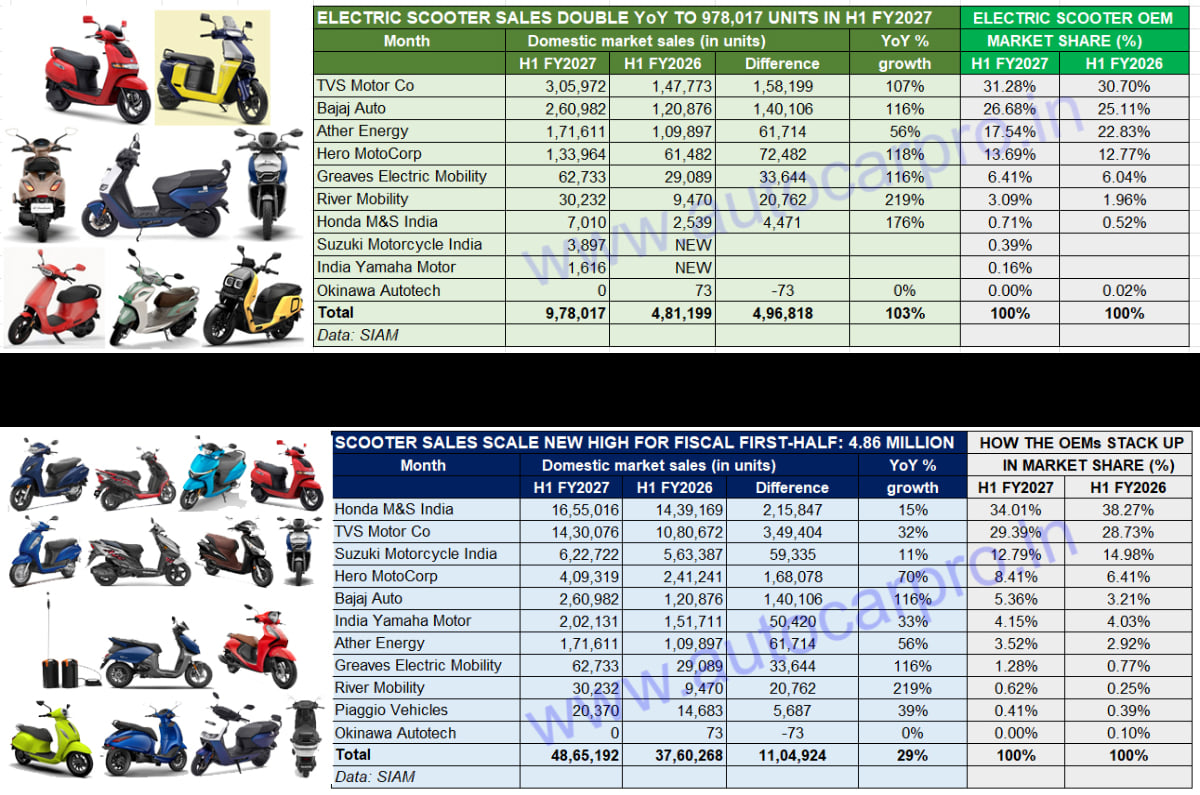
The fastest-growing part of the segment is electric. E-scooter wholesales hit 9,78,017 units in H1 FY2027, up 103 percent year-on-year from 4,81,199 units in H1 FY2026. This surge has pushed EVs’ share of total scooter sales from 13 percent to 20 percent in a single year.
TVS Motor Company leads the e-scooter market, with 3,05,972 iQube and Orbiter units dispatched, up 107 percent year-on-year, giving it a 31 percent share. Bajaj Auto is second, with 2,60,982 Chetak and Yulu units – a 116 percent jump – and a 27 percent share. Together, the two account for 58 percent of all e-scooters sold in the first half. Ather Energy, with 1,71,611 units and 56 percent growth, held third place, though its share dipped from 23 percent to 18 percent as the market expanded. Hero MotoCorp’s Vida dispatched 1,33,964 units, up 118 percent, for a 14 percent share.
The three Japanese players – Honda, Suzuki and Yamaha – collectively sold 12,523 e-scooters, accounting for a combined 1 percent share. Honda led the group with 7,010 units, up 176 percent.
Across ICE and EV models combined, Honda Motorcycle & Scooter India remains the category leader with 1.65 million units, up 15 percent, although its market share has dipped from 38 percent to 34 percent. TVS Motor Company is in second place with 1.43 million units and 32 percent growth, adding 3,49,404 units year-on-year. Nearly half of that incremental volume came from its electric lineup.
Suzuki, with 6,22,722 units and 11 percent growth, and Hero MotoCorp, with 4,09,319 units and 70 percent growth, hold third and fourth place, respectively. Bajaj Auto has climbed to fifth with 2,60,982 units and 116 percent growth, displacing Yamaha, which recorded 2,02,131 units, up 33 percent. Ather Energy is seventh with 1,71,611 units, while River Mobility has entered the top 10, overtaking Piaggio with 30,232 units of the Indie scooter.
With the festive season now underway, the industry will be looking to convert the strong H1 momentum into retail sales. Whether Q3 and Q4 can sustain the near-30 percent growth rate needed to push scooter sales past 10 million units for the first time remains to be seen, but the trajectory points firmly in that direction.
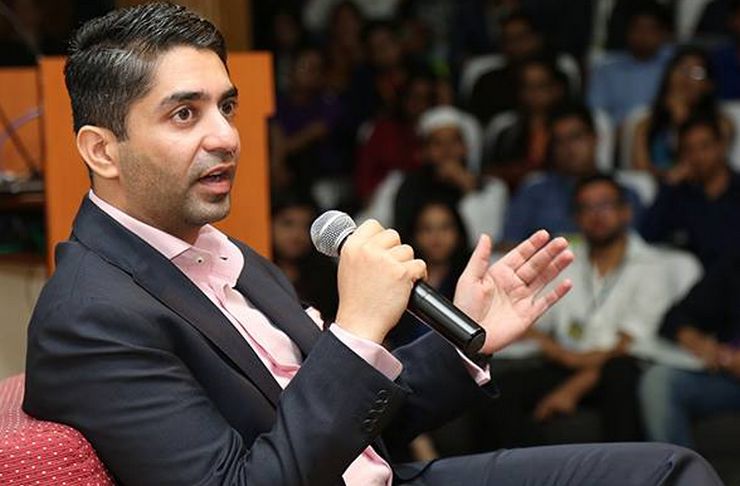
भारत के महान निशानेबाज अभिनव बिंद्रा ने शुक्रवार को कहा कि देश को ऐसे खिलाड़ियों की जरूरत है जो अपने ही काम पर, उन्हें बताई गई प्रक्रिया पर और उस ढांचे पर सवाल उठाये जिसमें वह काम करते हैं।बीजिंग ओलंपिक 2008 में व्यक्तिगत स्पर्धा का ओलंपिक स्वर्ण जीतने वाले पहले भारतीय बिंद्रा ने कहा कि उन्हें सफलता इसीलिये मिली क्योंकि वह सवाल पूछने का सामर्थ्य रखते थे।
उन्होंने संदर्भ का जिक्र नहीं करते हुए खिलाड़ियों को एक्स पर सलाह देते हुए कहा ,‘‘ मेरे पूरे खेल कैरियर में मैने कोचों से सवाल पूछे, सुझावों को चुनौती दी और उत्सुकता नहीं छोड़ी। इसलिये नहीं कि मैं सम्मान नहीं करता था बल्कि इसलिये कि मैं समझकर सीखना चाहता था।’’
Throughout my sporting career, I questioned my coaches, challenged ideas and remained curious. Not because I lacked respect but because I wanted to understand, learn and get better. I worry that when athletes feel they cannot speak freely, something far more troubling happens over time. They slowly stop questioning even in their own minds. And when that happens we loose something essential to sporting excellence. We need athletes who question their own work, their coaches, the methods recommended to them and the structures they operate within. Not out of defiance but out of a genuine desire to improve. What some might consider indiscipline may, in fact, be essential to growth. There is a difference between an athlete who refuses to learn and one who refuses to stop asking questions. Sport must be wise enough to recognise that difference.
उन्होंने कहा ,‘‘ मुझे चिंता है कि जब खिलाड़ियों को लगता है कि वे खुलकर अपनी बात नहीं कह सकते, तो समय के साथ कुछ कहीं ज्यादा चिंताजनक स्थिति पैदा हो जाती है। वे धीरे-धीरे अपने मन में भी सवाल पूछना बंद कर देते हैं। और जब ऐसा होता है, तो हम खेल में बेहतरीन प्रदर्शन के लिए जरूरी एक अहम चीज खो देते हैं।’’
बिंद्रा ने कहा ,‘‘ हमें ऐसे खिलाड़ी चाहिये जो अपने काम, अपने कोचों और उन्हें बताई गई प्रक्रिया पर सवाल उठा सकें। विद्रोह के लिये नहीं बल्कि बेहतर प्रदर्शन की वास्तविक इच्छा के लिये। कुछ को यह अनुशासनहीनता लग सकती है लेकिन विकास के लिये जरूरी है।’’उन्होंने कहा ,‘‘ सीखने की इच्छा छोड़ देने वाले खिलाड़ी और सवाल पूछना बंद करने वाले खिलाड़ी में फर्क है। यह अंतर समझना जरूरी है।’’
अब 43 साल के हो चुके बिंद्रा ने 2008 बीजिंग ओलंपिक में 10 मीटर एयर राइफल में स्वर्ण पदक जीता था। वह ओलिंपिक खेलों में व्यक्तिगत स्वर्ण पदक जीतने वाले भारत के पहले खिलाड़ी हैं।
वह 2010 से 2020 तक अंतरराष्ट्रीय निशानेबाजी खेल महासंघ (International Shooting Sport Federation ISSF) की एथलीट समिति के सदस्य थे जिसमें वह 2014 से इसके अध्यक्ष रहे। वह 2018 से आईओसी एथलीट आयोग के सदस्य हैं।
The Indian scooter industry has hit a new milestone, recording its highest-ever monthly dispatches in September 2026. A total of 9,95,576 scooters were dispatched during the month, marking a substantial 34 percent jump over the 7,42,602 units sold in September 2025 and comfortably surpassing the previous monthly record of 8,55,715 units set just a month earlier, in August 2026.
Highest monthly total in the segment’s history, falling just 4,424 units short of the 10 lakh mark
Honda led with 3,83,035 units, followed by TVS at 2,77,115 units
Electric scooter dispatches reached 1,86,692 units
September 2026 scooter sales
Honda and TVS dominate sales
Honda Motorcycle and Scooter India led the segment by a wide margin, dispatching 3,83,035 units – a 46 percent year-on-year increase – to claim roughly 38 percent of the market. TVS Motor Company was second with 2,77,115 units, up 29 percent, accounting for around 28 percent of the market. Together, the two OEMs accounted for approximately two-thirds of all scooter dispatches during the month.
Suzuki and Hero MotoCorp rounded out the top four, with 1,06,274 units (+1 percent) and 96,254 units (+67 percent), respectively.
Electric scooters continue their climb
The electric segment had another strong showing, with 1,86,692 scooters dispatched in September – a 68 percent year-on-year increase. This was the second-highest month on record for electric scooters, behind only August 2026, when dispatches reached 1,88,714 units.
TVS led the charge in terms of EV volumes, with its iQube and Orbiter models together clocking 62,347 units – more than double the year-ago figure. Hero MotoCorp’s Vida range sold 28,962 units, up 88 percent, while Bajaj’s Chetak posted 28,862 units, also up 88 percent. Ather Energy dispatched 30,121 units, a 20 percent increase, with its recently launched mass-market Konarc expected to add further momentum.
For the April-September period, scooter dispatches totalled 48.2 lakh units, up 29 percent year-on-year, underlining the segment’s consistent growth trajectory heading into the festive second half of the fiscal year.
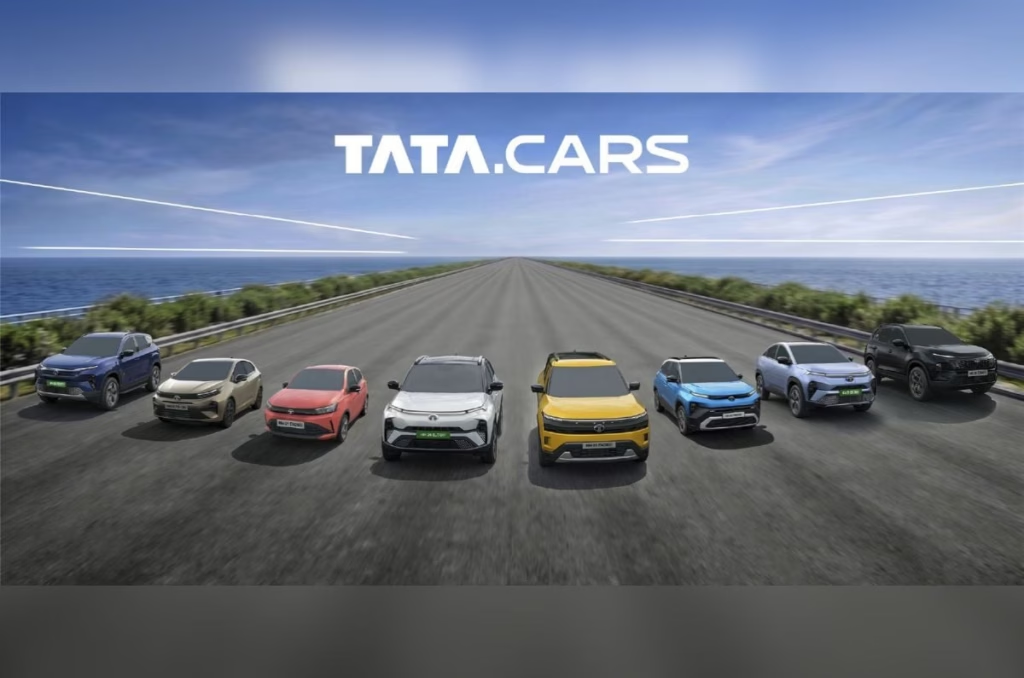
Tata’s passenger vehicle (PV) business grew by 35 percent in its first year after the demerger, which came into effect on October 1, 2025, and separated the commercial vehicle (CV) business from the PV division. Domestic sales between October 2025 and September 2026 stood at 7.44 lakh units, well ahead of the industry’s roughly 22 percent growth. According to the home-grown brand, its market share increased to 14.1 percent, making it India’s second-largest carmaker over this period.
Factors behind the Tata PV business growth
Two SUVs and a GST cut did much of the heavy lifting
One of the major factors behind Tata’s strong numbers is the revised GST rates, which took effect on September 22, 2025. This was shortly before the October 1 demerger, and it made cars more affordable across multiple segments. Despite this, Tata Managing Director Shailesh Chandra admitted to being surprised. “We had not expected 35 percent,” he said.
According to Chandra, monthly bookings topped one lakh more often than not, and more than seven in ten of these typically turned into retail sales. Tata crossed the 70,000-unit mark in a single month twice, and two of its quarters went past two lakh units.
With sales of 2.38 lakh units and 2.33 lakh units respectively, the Nexon and Punch accounted for around 63 percent of Tata’s domestic volumes over this period. Sales of the Sierra, meanwhile, crossed 60,000 units between January and September 2026. This is despite supply being constrained even as production was being scaled up.
Tata EV and CNG sales make up nearly half of volumes
Tata Motors claimed that EVs and CNG cars accounted for 44 percent of its annual volumes, rising to about 51 percent in the July-September quarter. Sales of fully electric models were up 84 percent (at 1.3 lakh units), with the brand claiming a 42 percent share of India’s EV market. Sales of CNG models grew by 31 percent, registering over 2.03 lakh units.
However, each powertrain faces a different set of rivals. “For EVs, my competitors are different,” said Chandra. Product development for all powertrain categories now falls under a single chief product officer, though each gets its own dedicated team.
Tata Motors targets 12 lakh annual sales by FY31
Six new nameplates are on the way
Tata is targeting over 12 lakh units per year by FY31 (financial year 2031), with a 20 percent share of the Indian passenger vehicle market. According to Tata, the plan involves over 20 product refreshes and the introduction of six new nameplates, including the Avinya.
What the brand calls its “15 product interventions” over the past year included models such as the Sierra and Sierra.ev, the updated Punch, Punch.ev, Tiago and Tiago.ev, petrol versions of the Harrier and Safari, and the Aeris. The Indian automaker said that it’s also recalibrating launch timelines. This, it said, is to ensure that each new model gets proper marketing support and that dealers have enough time to sell them.
The recent surge in demand means production capacity has become an immediate priority for Tata Motors. The company stated that its plants and suppliers are stretched thin, particularly smaller tier-two and tier-three firms, and that it has had to work more closely with them to resolve shortages. More capacity will come online at Tata’s existing plants, with the Sanand facility playing a major role. Helped by Tata’s entry into South Africa, exports have nearly doubled, to around 12,000 units.
Tata Motors to triple service network and focus on quality
The brand said that its workshops will grow faster than its showrooms
Apart from focusing on growth, Tata Motors will also be paying attention to addressing the quality and after-sales perception. The quality department now reports directly to Chandra instead of to the manufacturing department, the Managing Director stated. Tata has also set up a central software integration team, which will eventually become a ‘centre of excellence’. Tata now also tests software and hardware together earlier in development. In fact, the Sierra is one of the first models developed this way, the company mentioned.
Another point of attention is the brand’s service network, with Chandra stating that Tata’s workshops now see about six lakh vehicles per month – this is up from around 1.5 lakh in 2021. “My showrooms will increase by two times. But my service centres will increase by three times,” Chandra said. The automaker has addressed 26 of the 30 locations that it flagged as service problem areas, with dealer incentives now placing more weight on customer experience.
Between April and June, the availability of spare parts was an issue. This, the company said, was due to labour constraints, when production was being prioritised. It’s providing existing customers first claim on spare parts even if that affects the production of new cars, with Chandra claiming fill rates are back at around 85-86 percent. Regardless, changes will take time. “The perception will only change after three-four years,” Chandra admitted. “After people really see the consistency of that.”
With inputs from Hormazd Sorabjee and Ketan Thakkar.
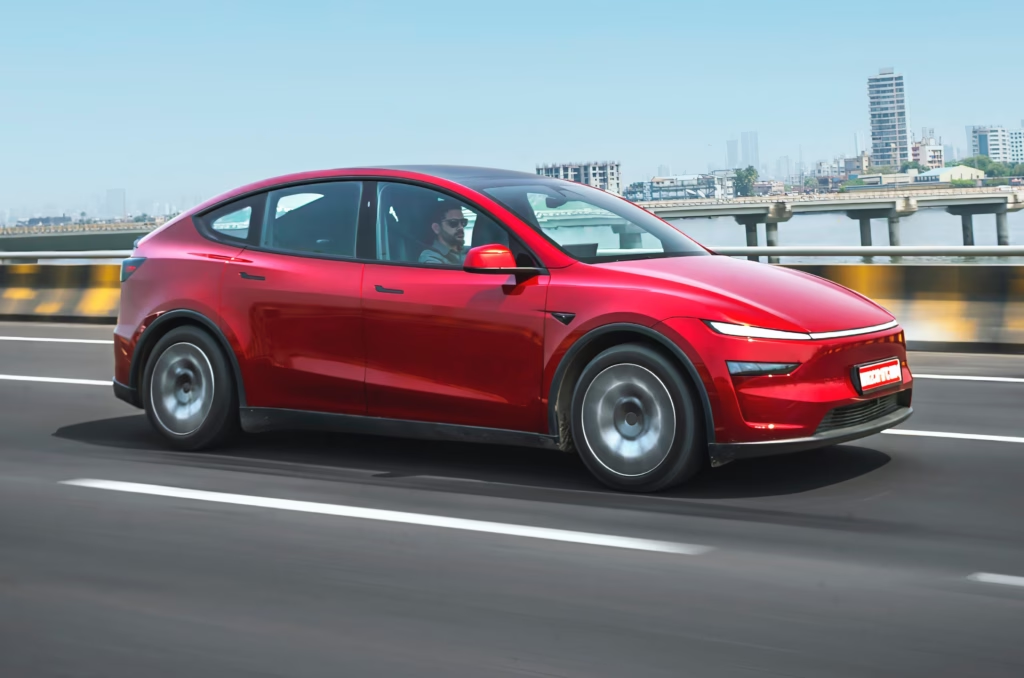
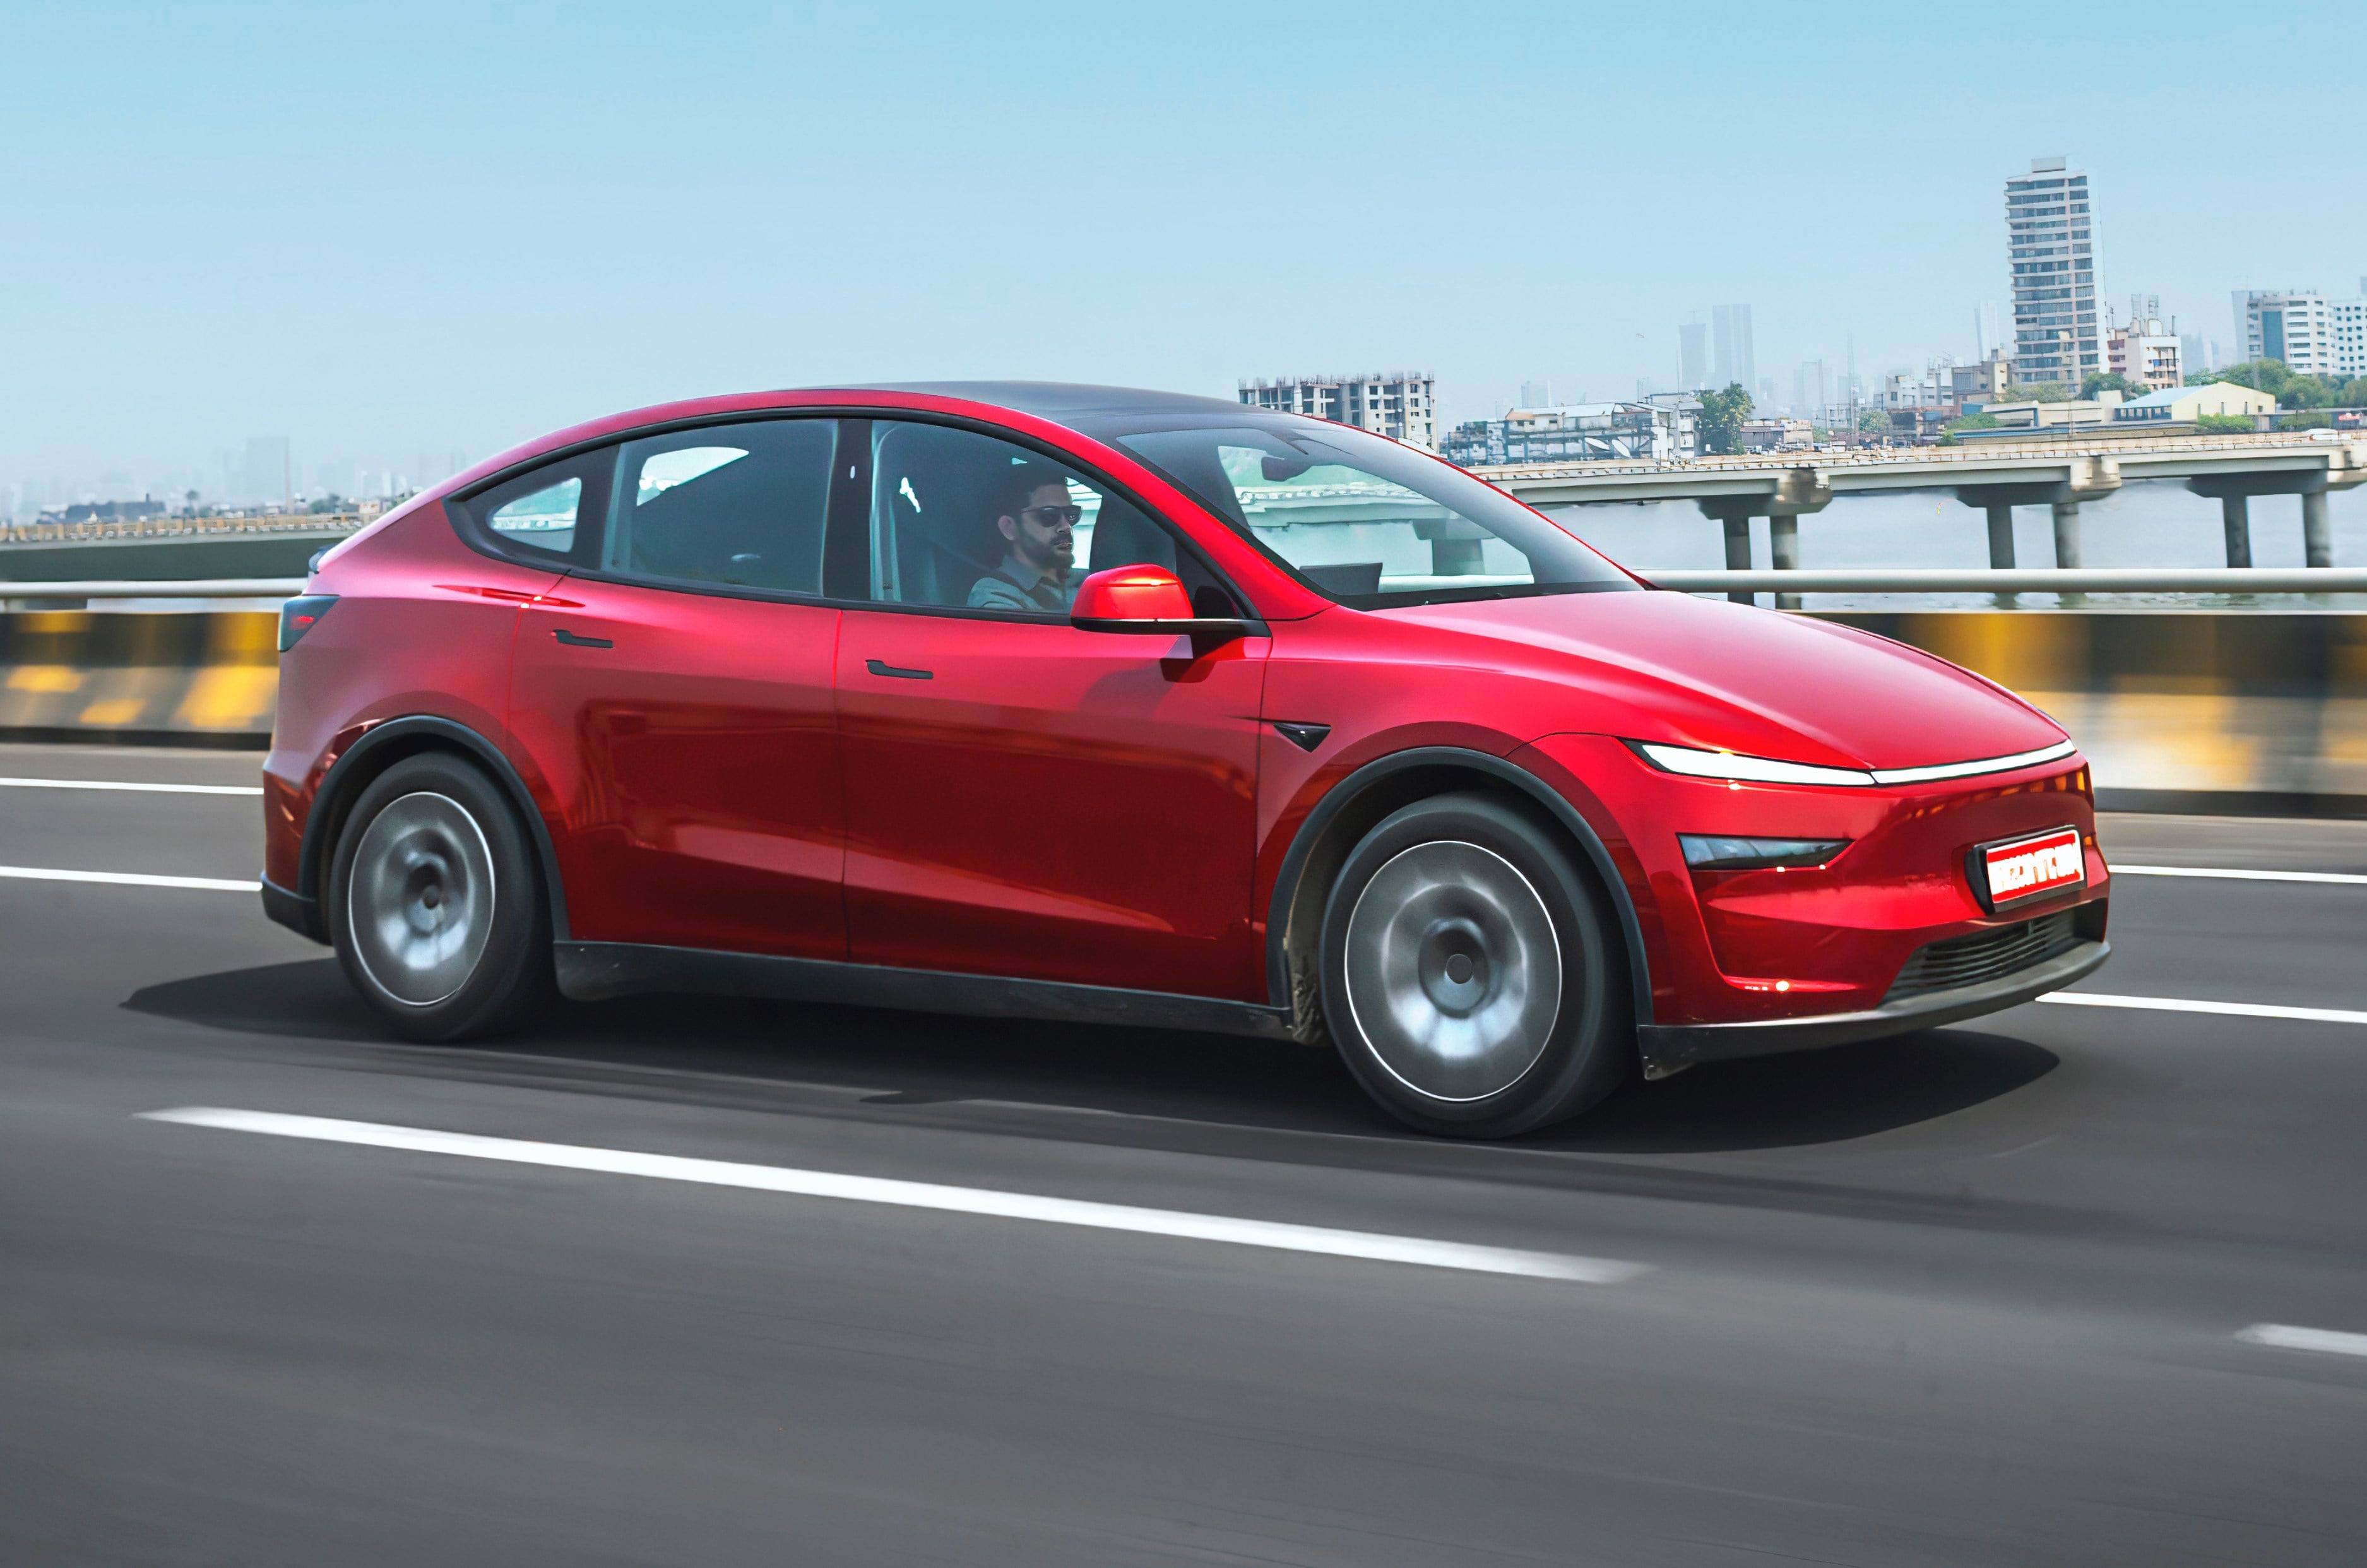
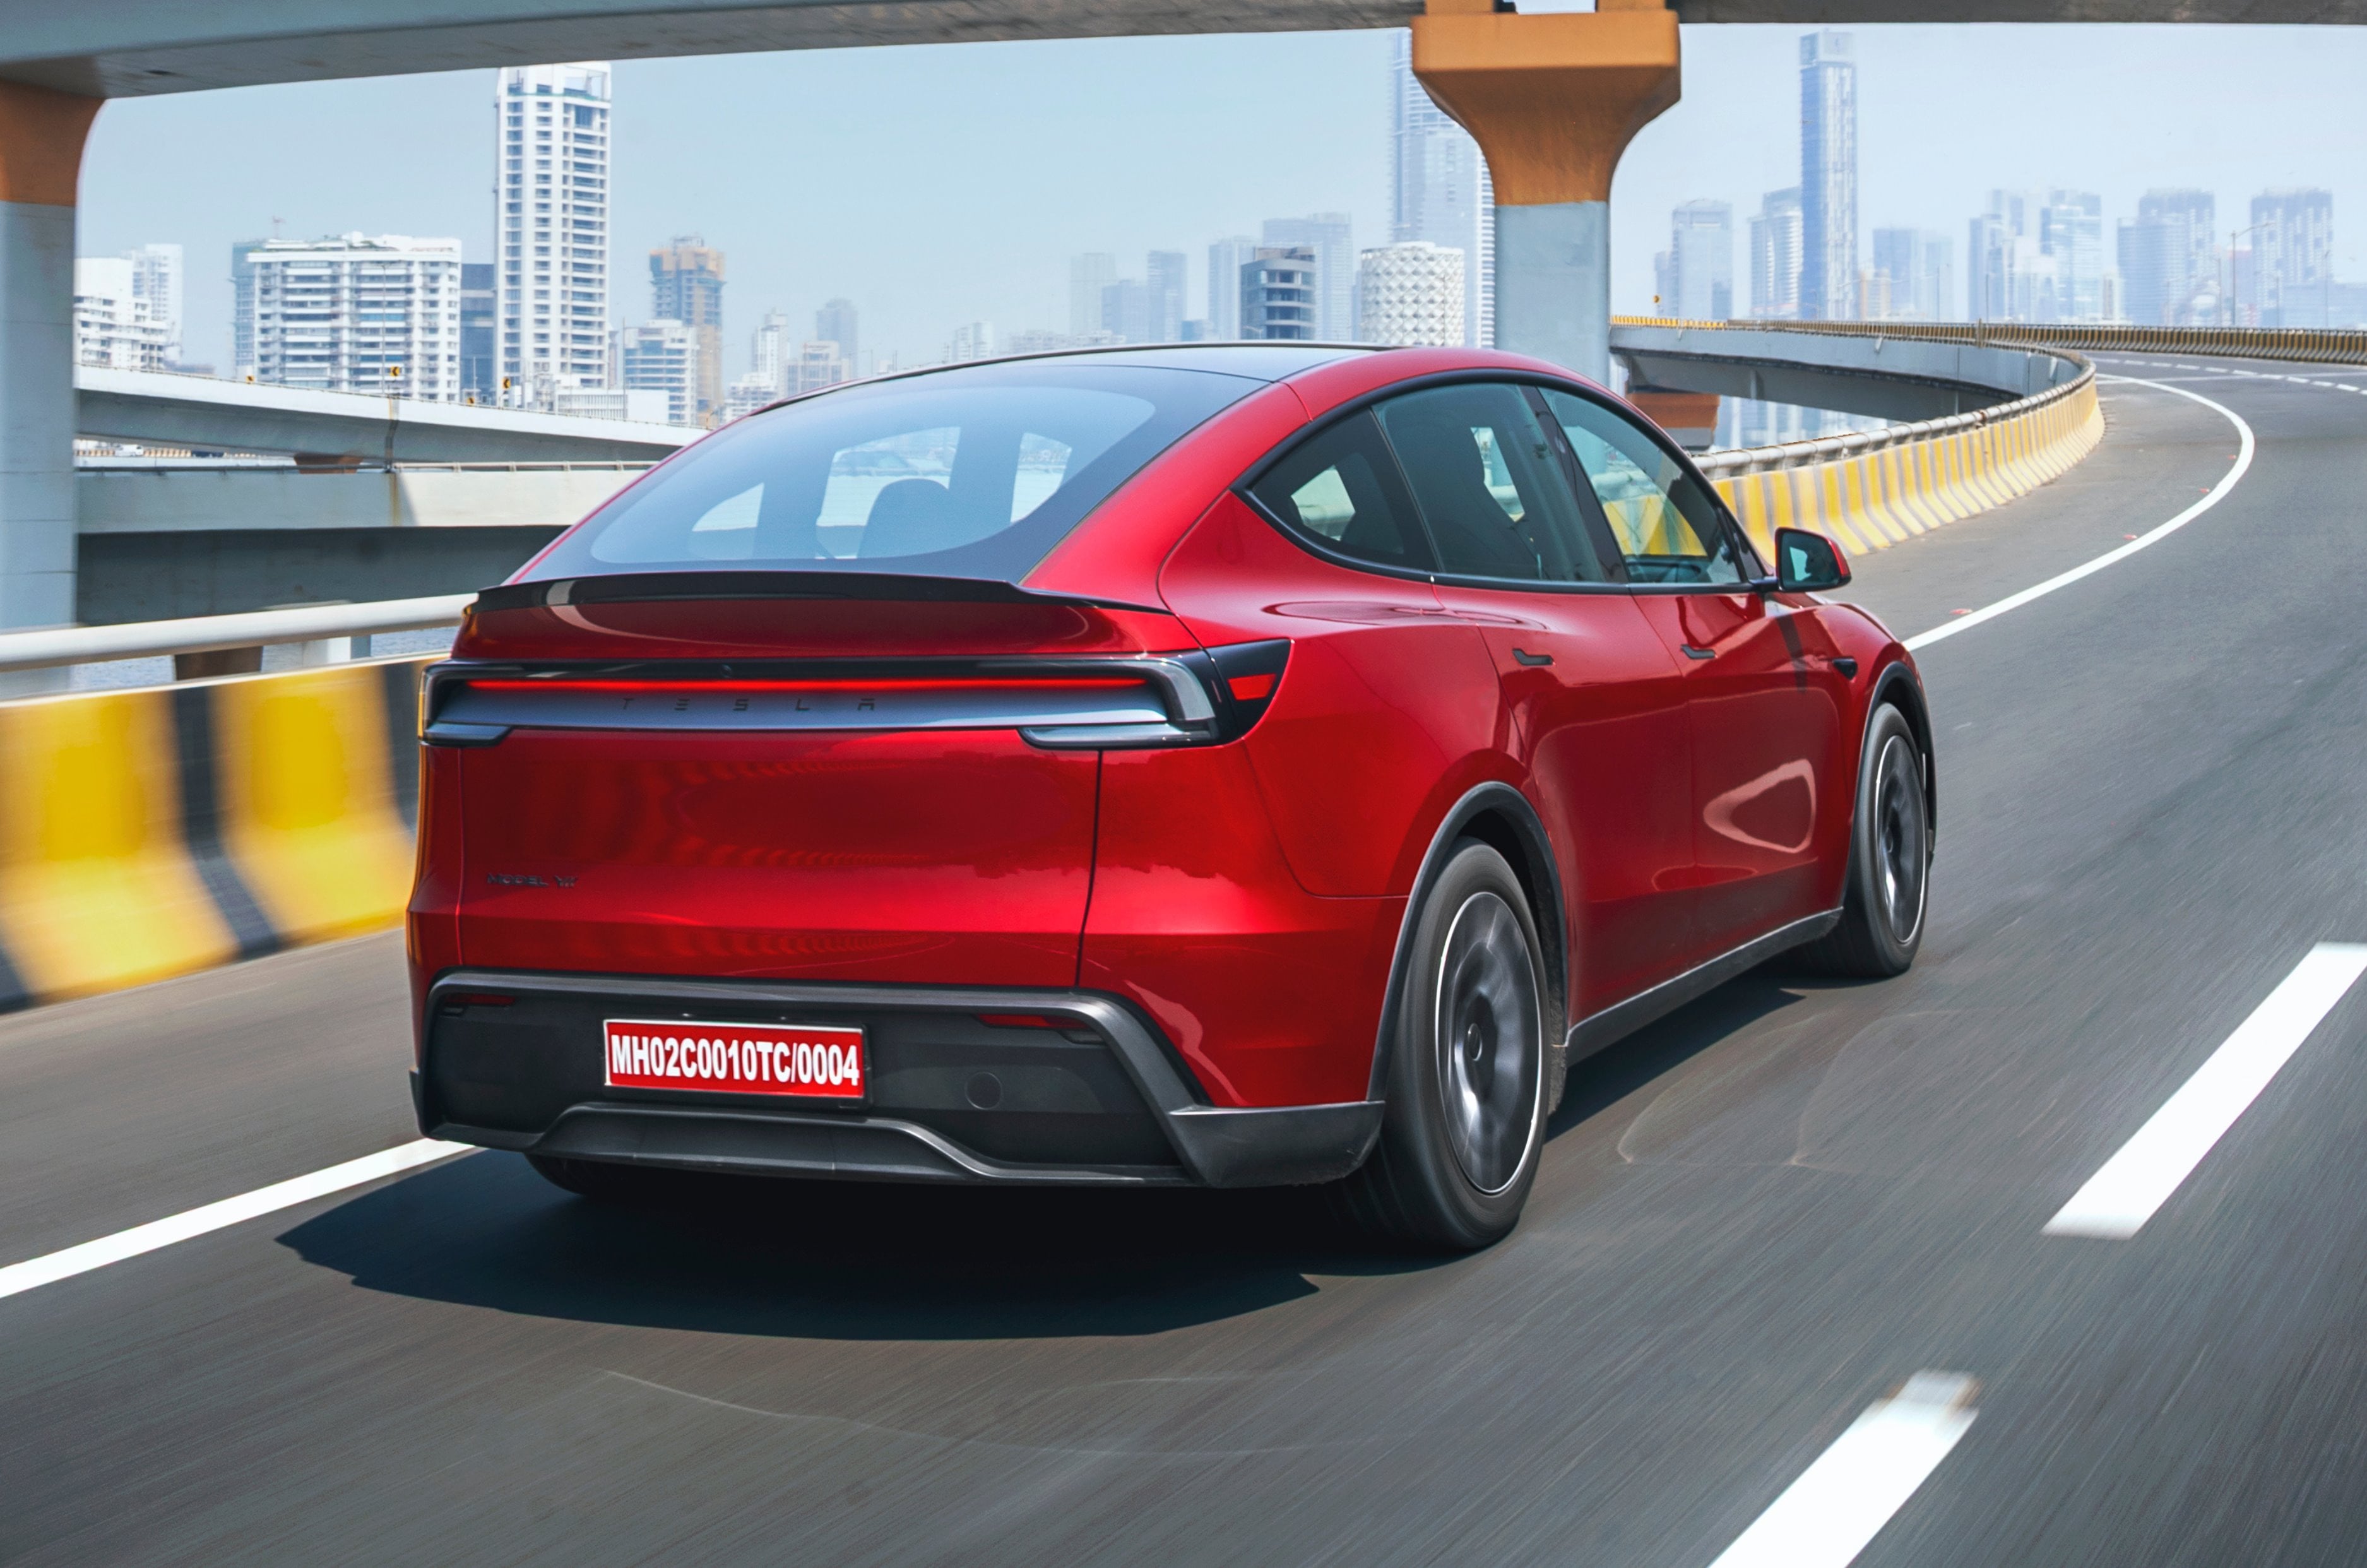
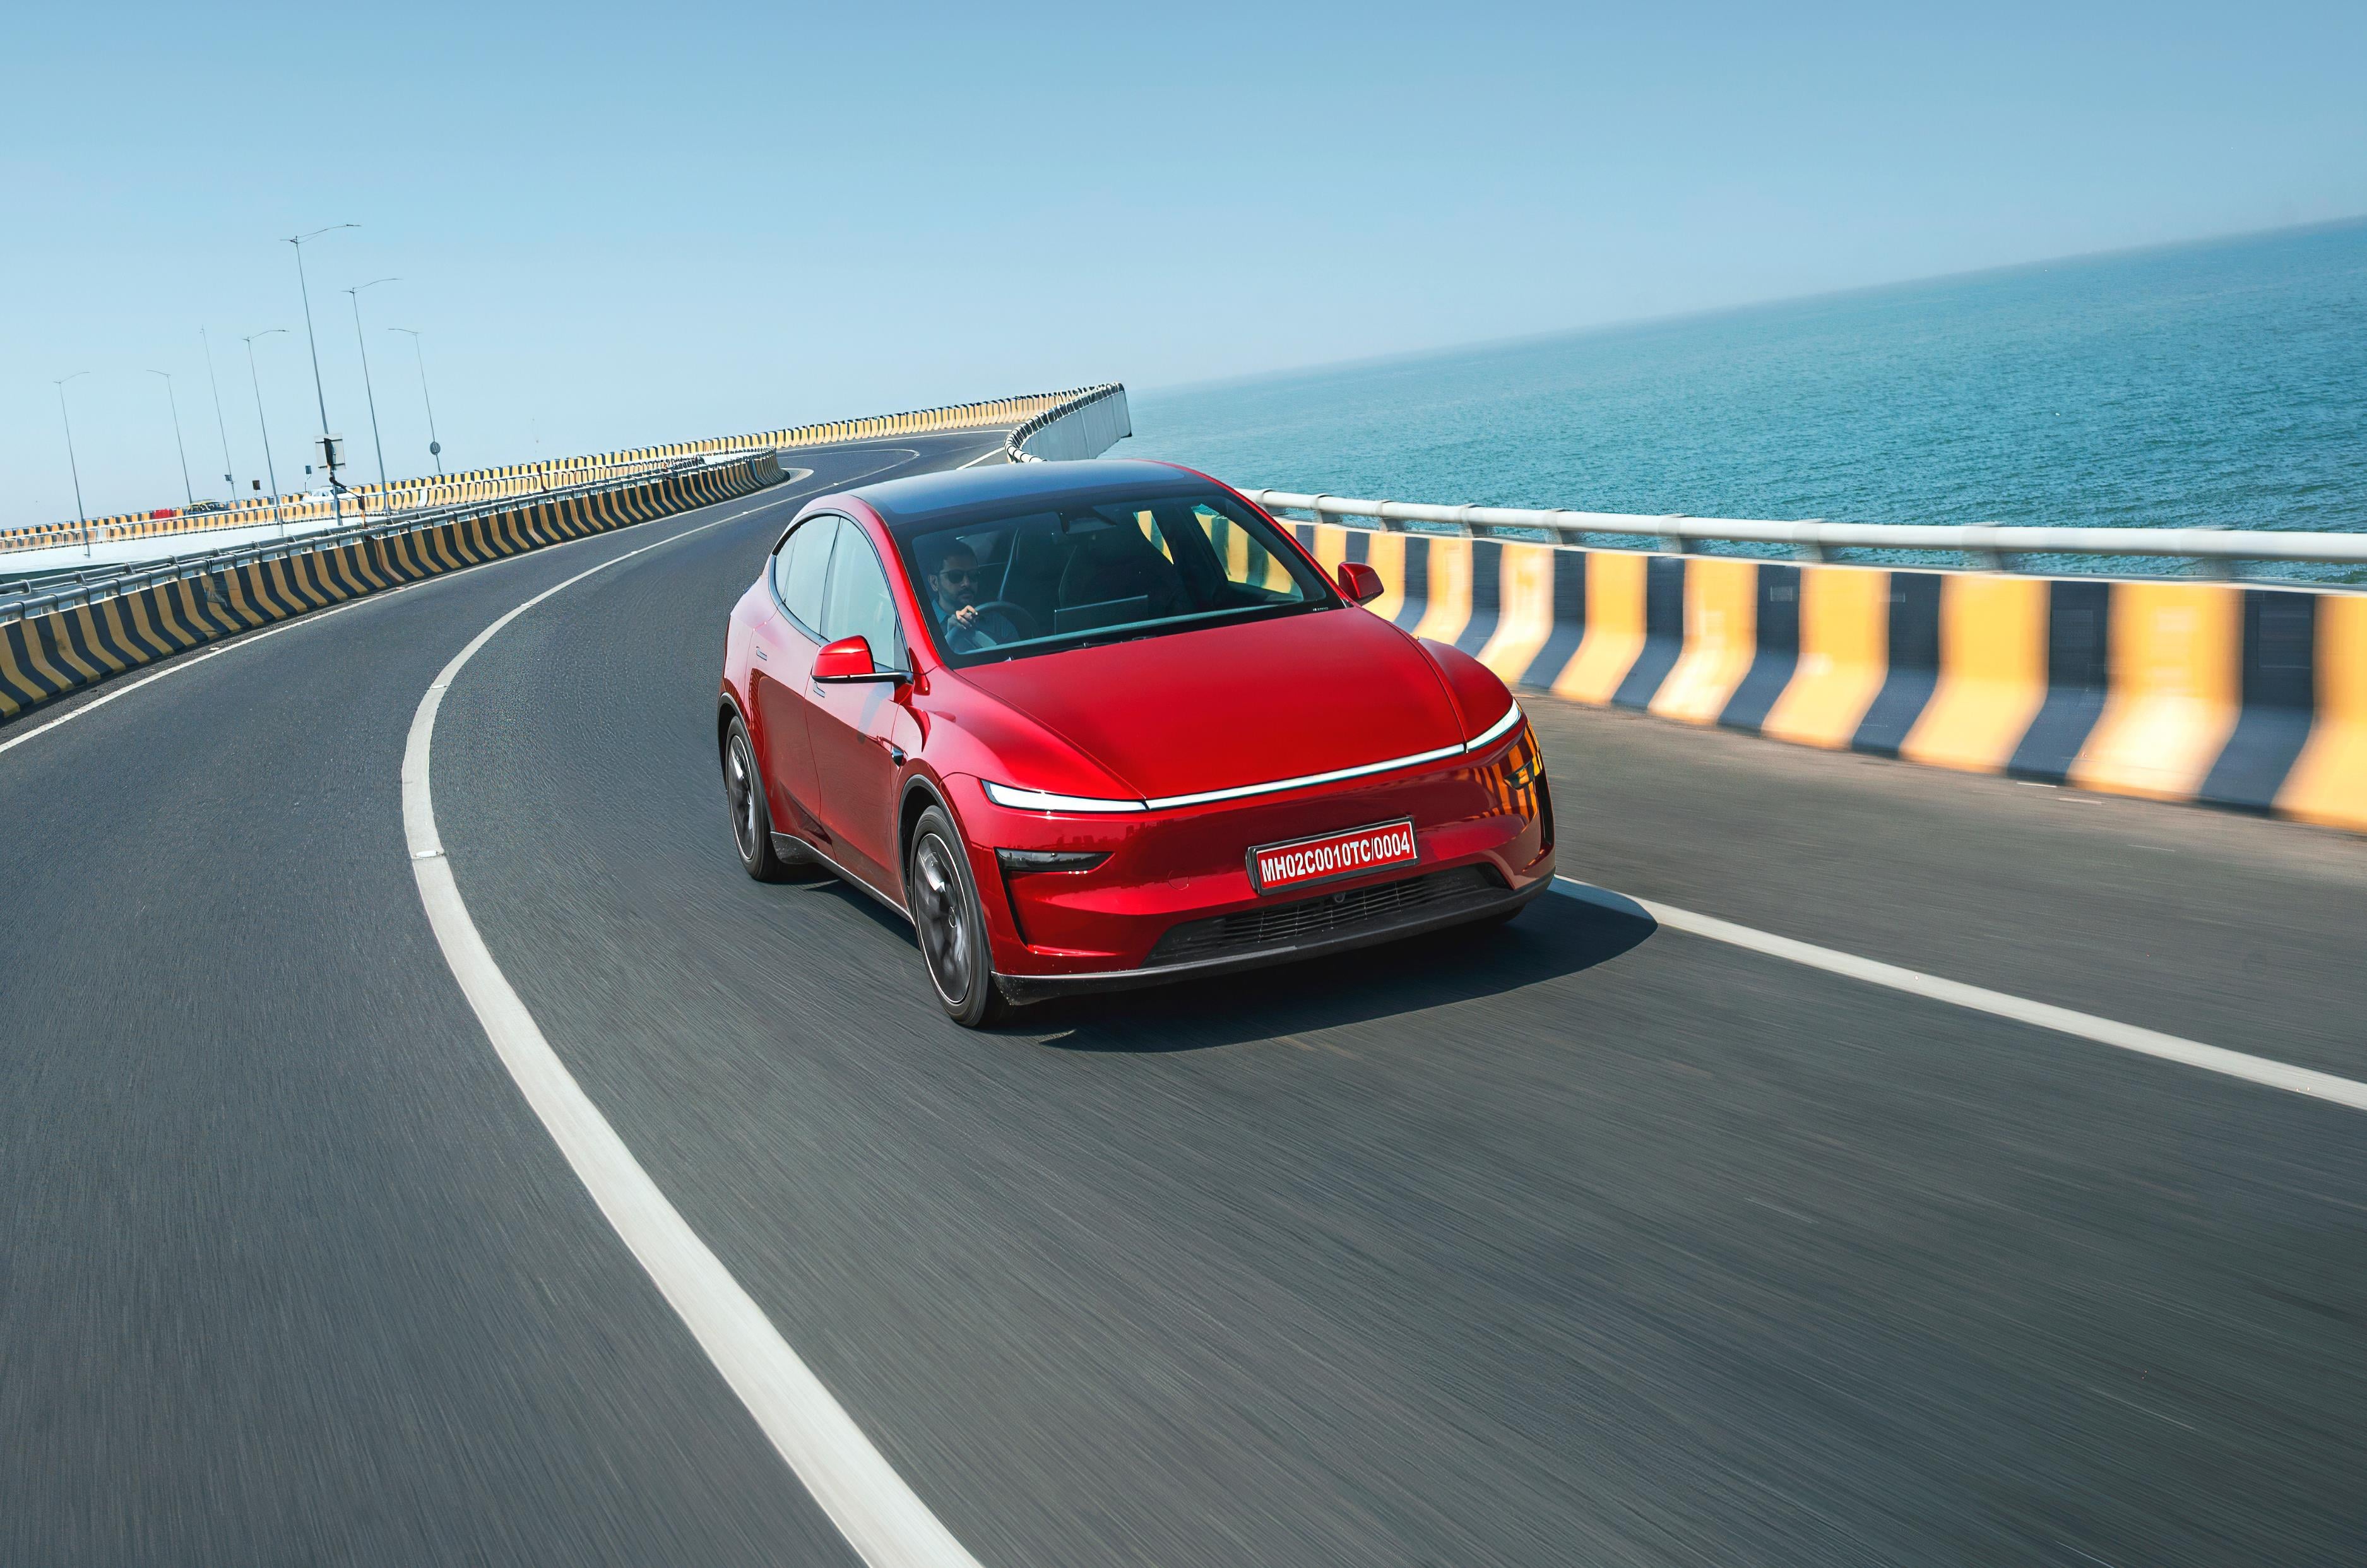
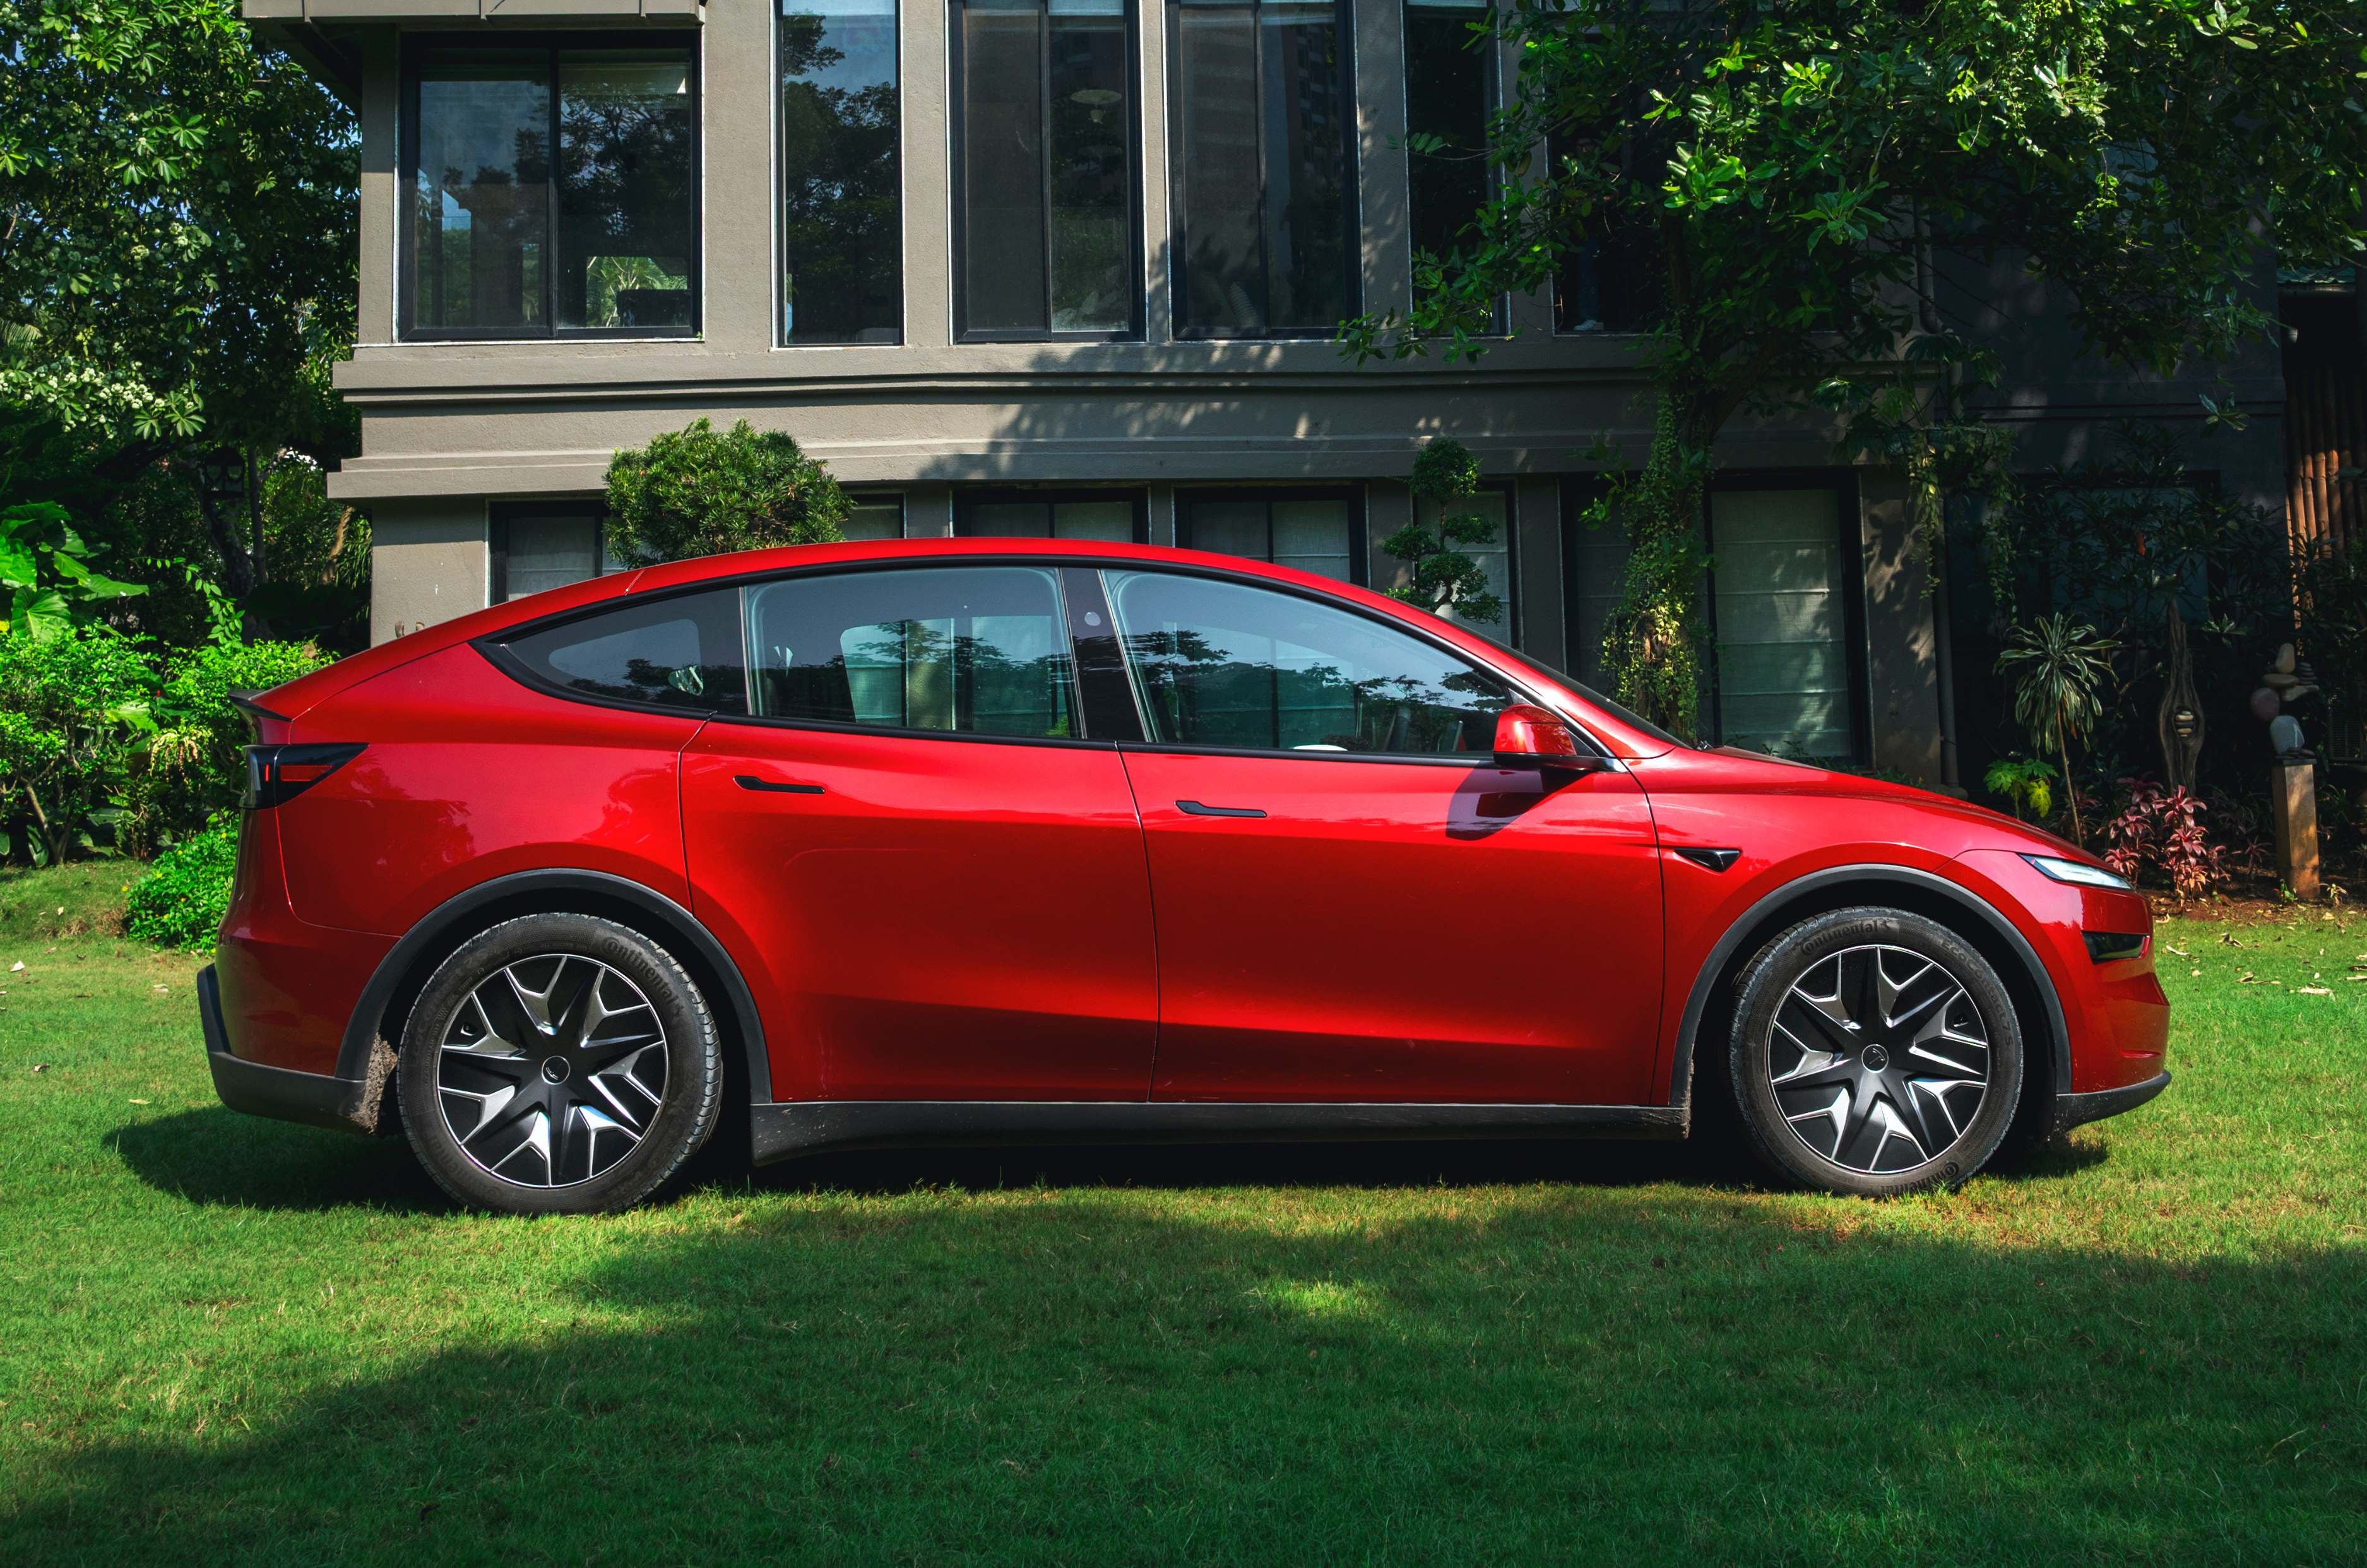
The Tesla Model Y is a tech-loaded electric crossover that prioritises cabin space and performance over everything else. The new Model Y L takes that formula a step further, adding a third row of seats, a longer wheelbase, more power with an all-wheel drive setup, more range and more sophisticated suspension as well. Given the additions, naturally it costs more than the standard-wheelbase, real wheel drive versions, but is the Y L actually worth the extra outlay?
Model Y Exterior Design and Engineering – 6/10
Appears near-identical to the Model Y, but the Y L is longer, taller and has a longer wheelbase.
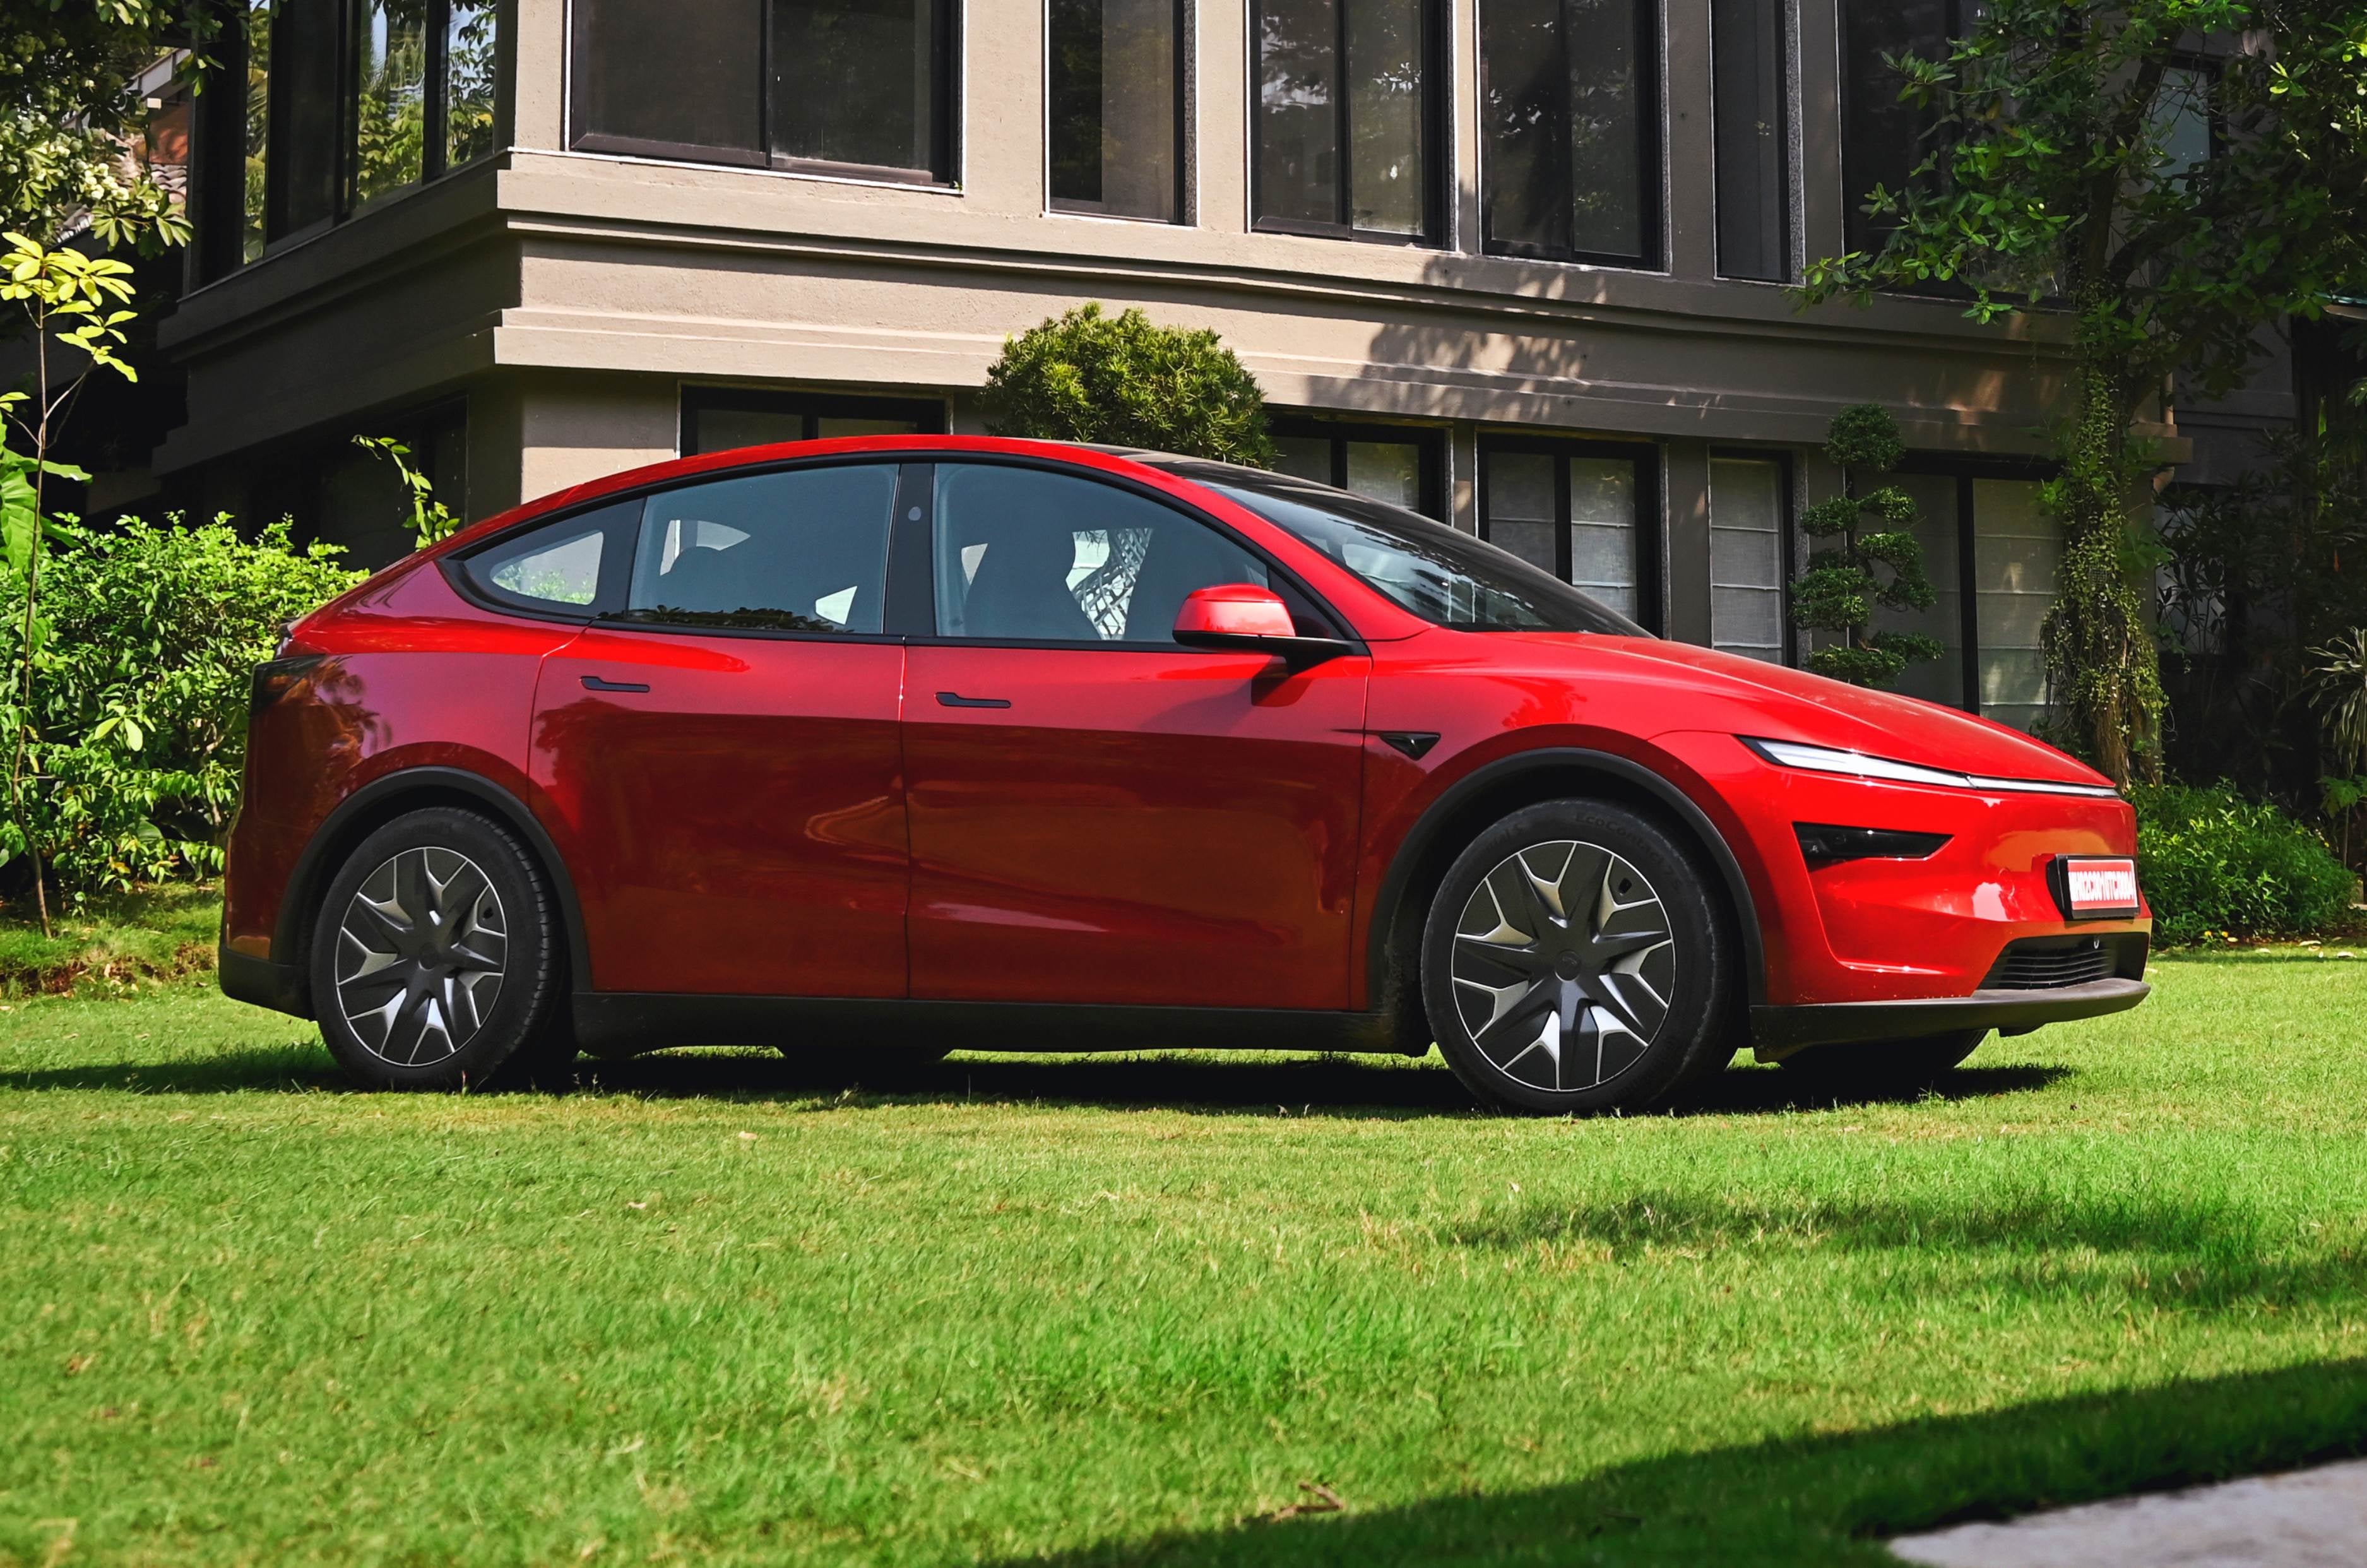
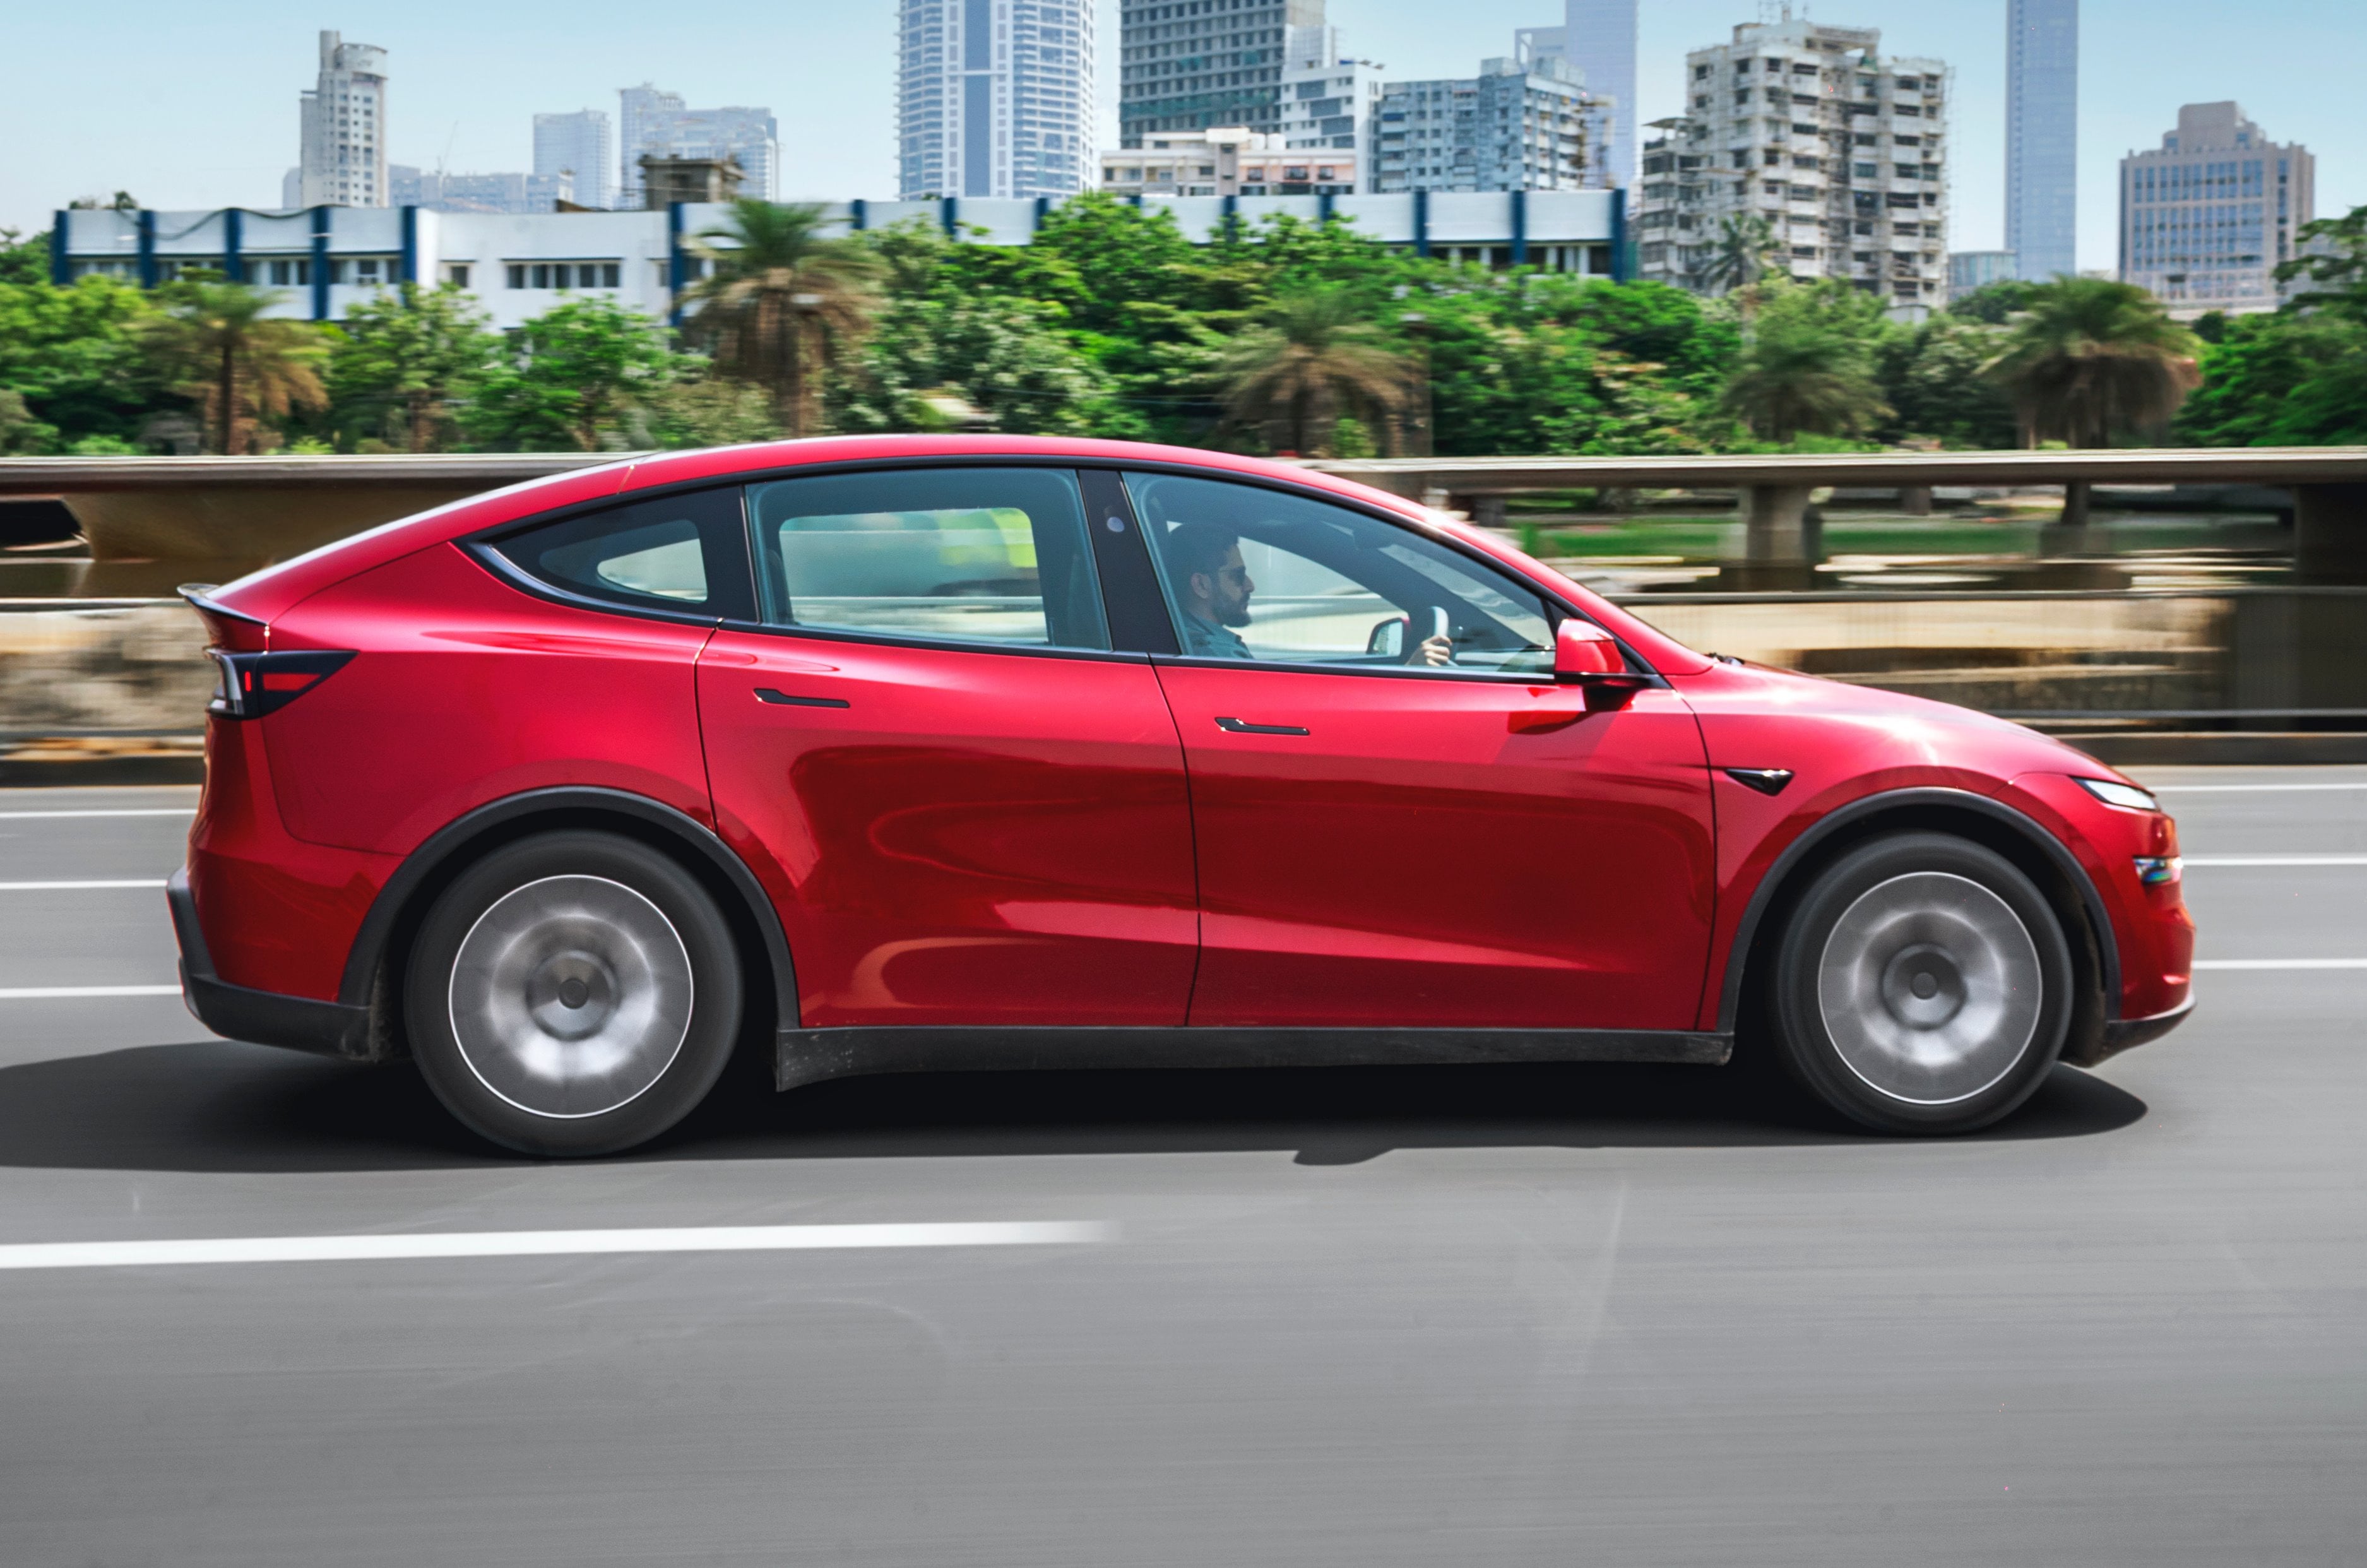
At first glance, the L looks very familiar to the Model Y, but this version looks noticeably larger from the side and rear. The Model Y L measures 4,969mm in length and 1,664mm in height, 1,982mm in width with a 3,040mm wheelbase, which makes it 179mm longer overall and 40mm taller than the Model Y, and it also has a 150mm longer wheelbase. At 166mm (unladen), the Y L has decent ground clearance but considering the longer wheelbase, you have to be extra careful going over big speedbreakers otherwise you will end up scraping the belly.
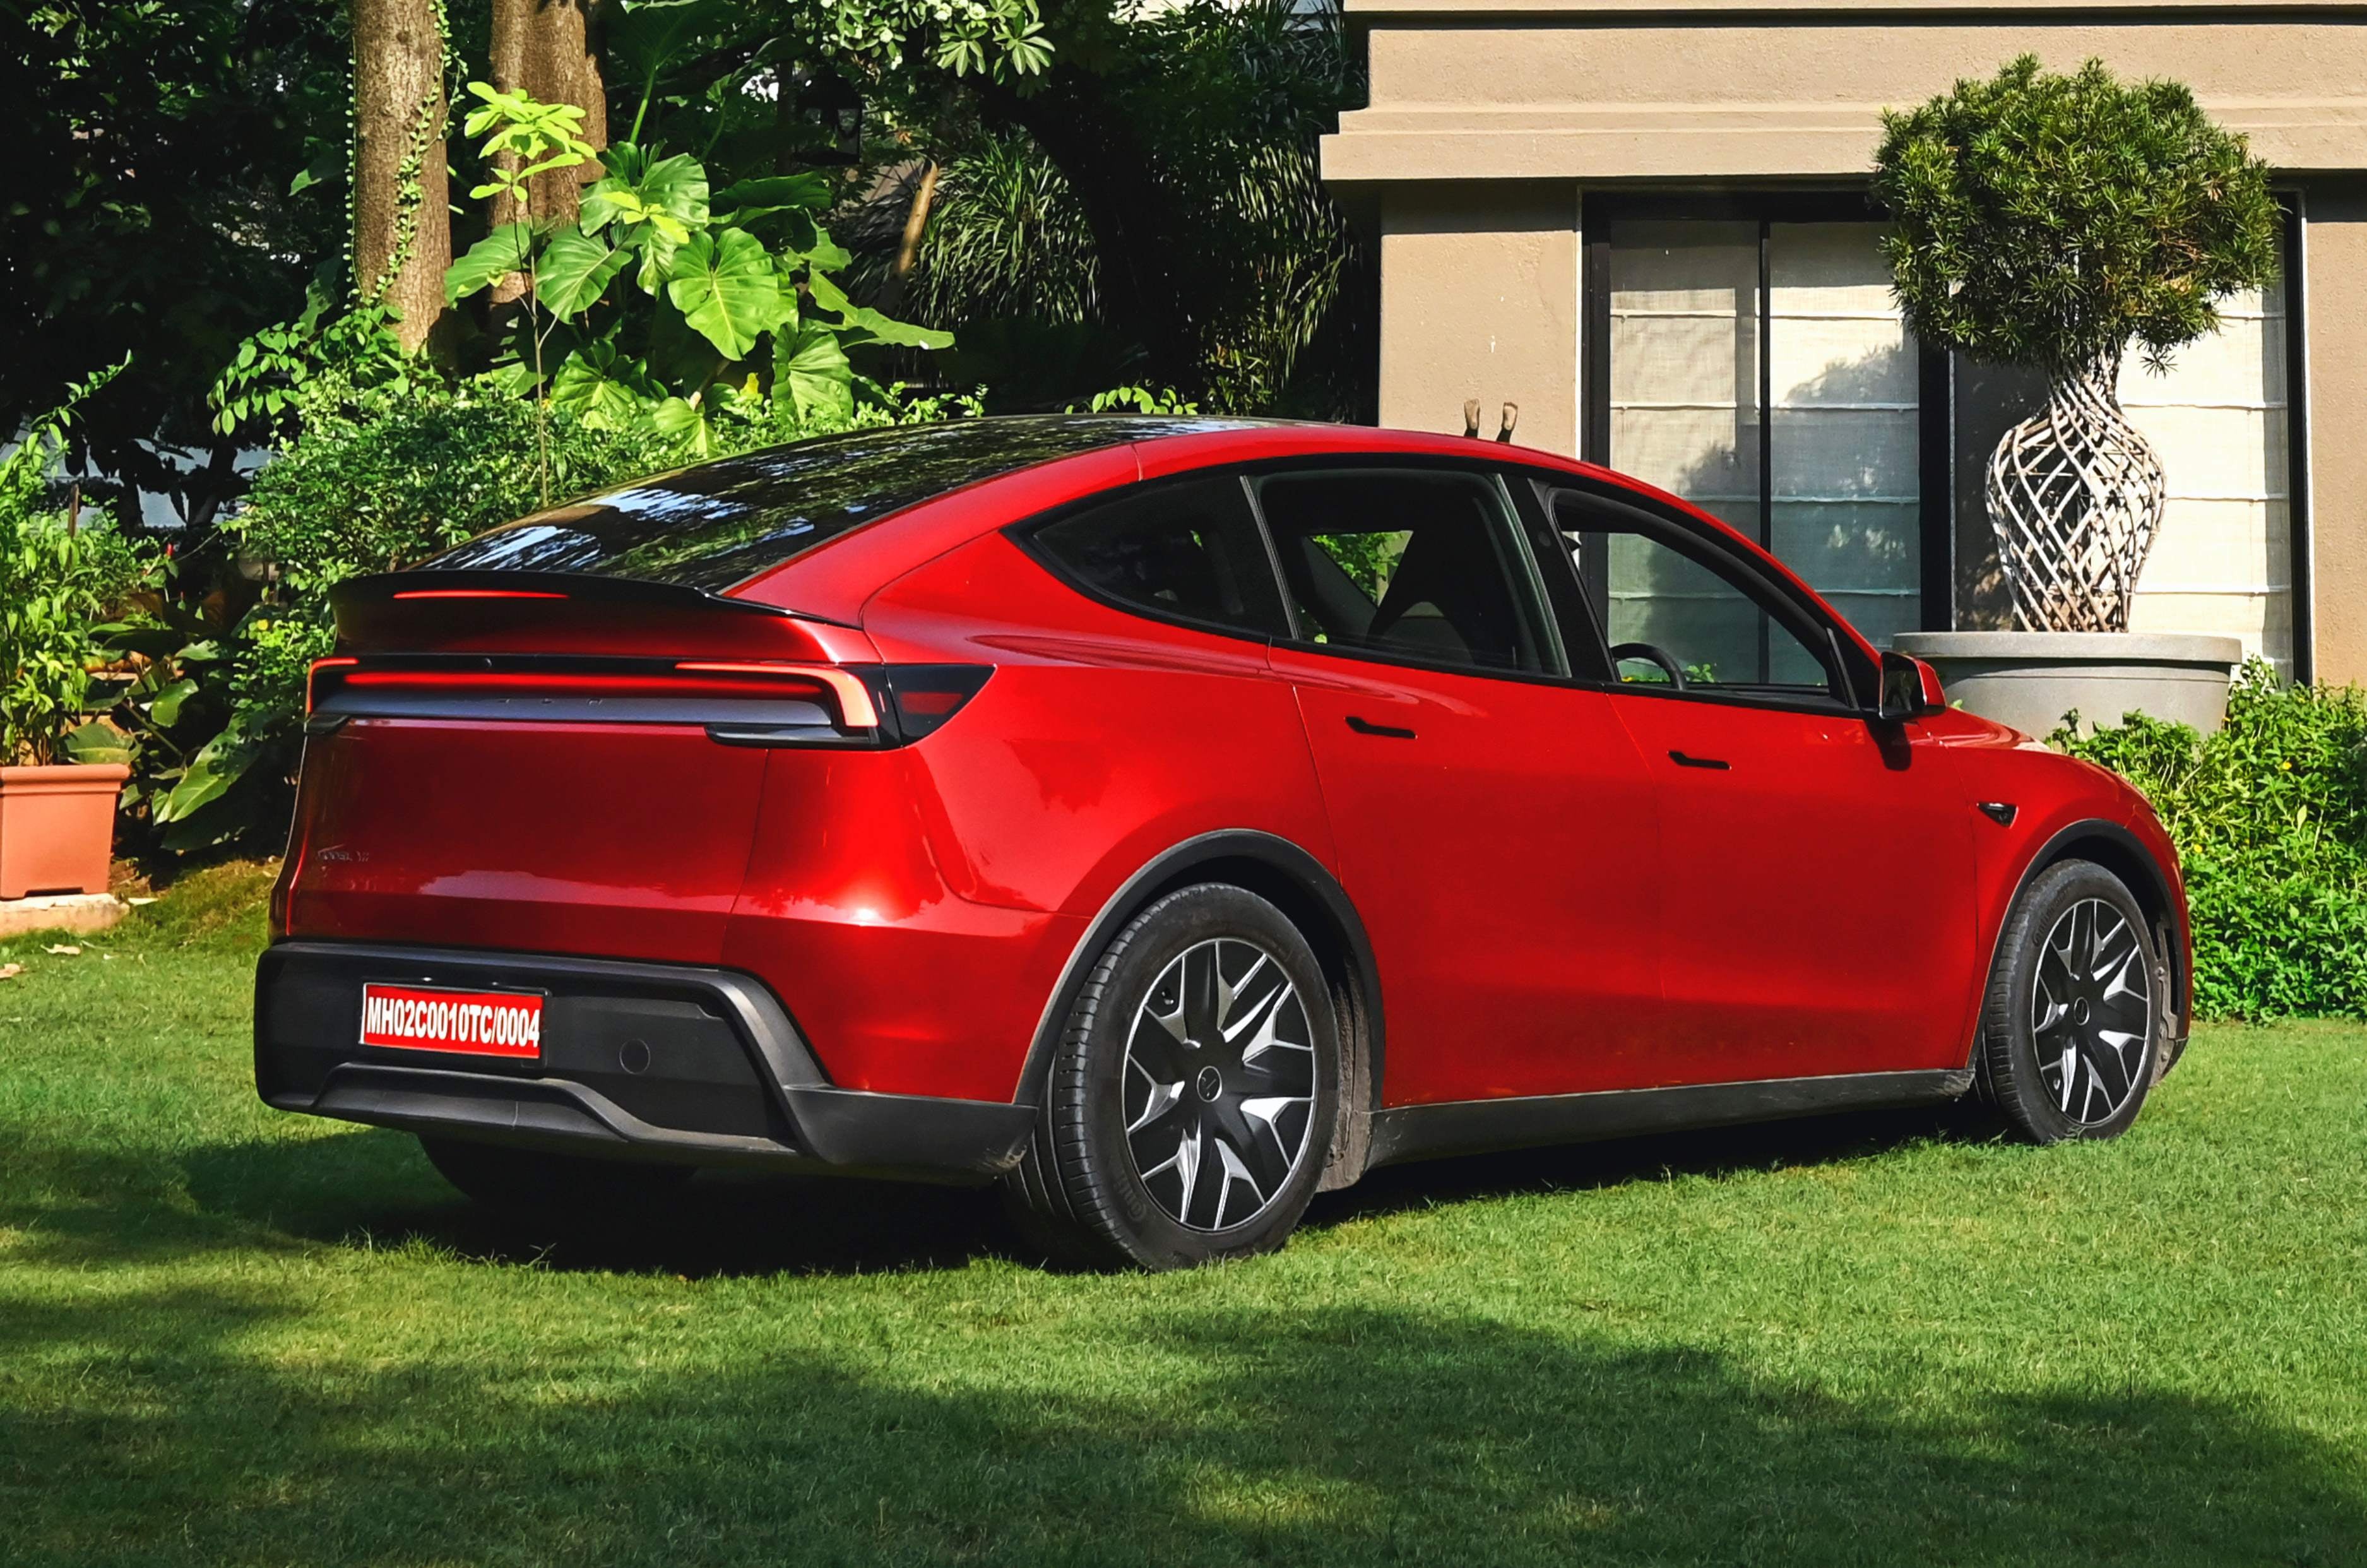
The growth in dimensions is particularly apparent in the raised and extended roofline, plus the expanded rear glass and rear-quarter glass area. The other changes include a new bootlid spoiler and the 19-inch alloy wheels have a more enclosed design, both in the interest of further aero optimisation.
Other than that, the smooth, aerodynamic silhouette with minimalist detailing and distinctive lighting elements remain. The overall design is unmistakably Tesla, although the extra length gives it slightly more road presence. That said, the Model Y L doesn’t suddenly become a traditional SUV just because it has grown. Its rounded, slightly anonymous shape with clean surfacing continues to favour aerodynamic efficiency over visual appeal. But it looks distinctive and as such, has carved out a niche for itself in terms of design.
Model Y Interior Space and Comfort – 8/10
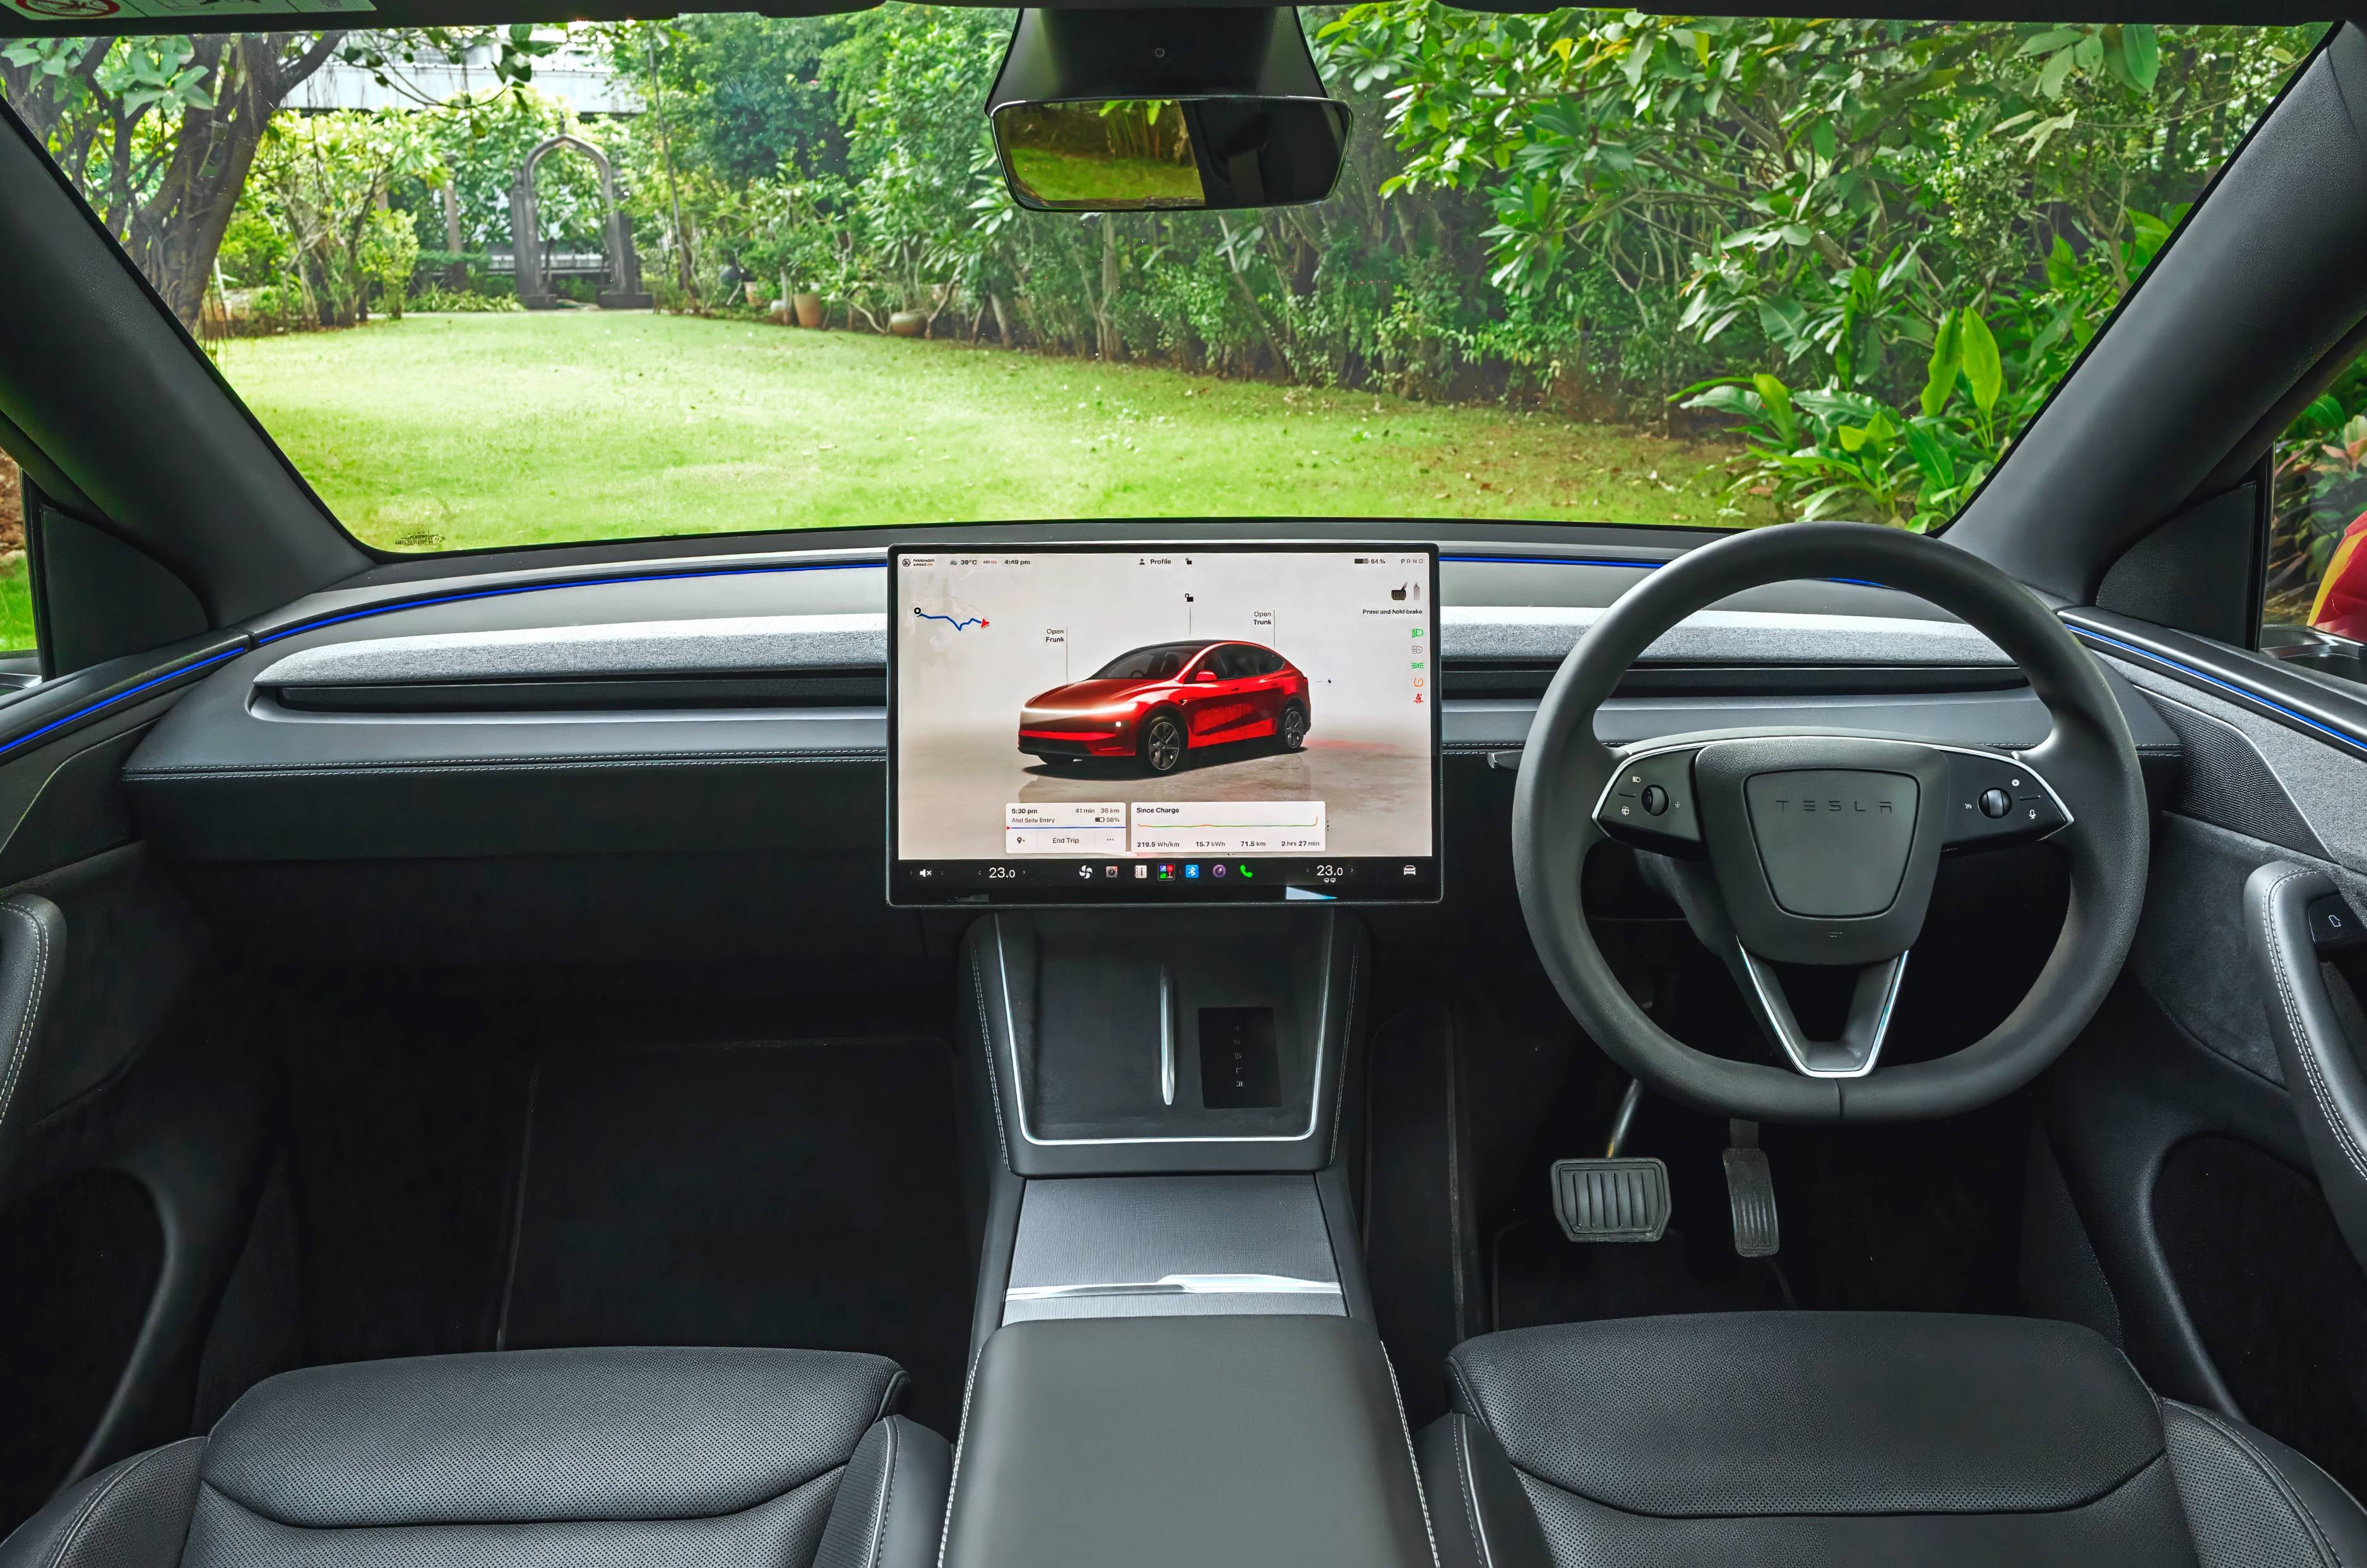
Minimalist design remains the same, save for a new textured finish on top of the dashboard.
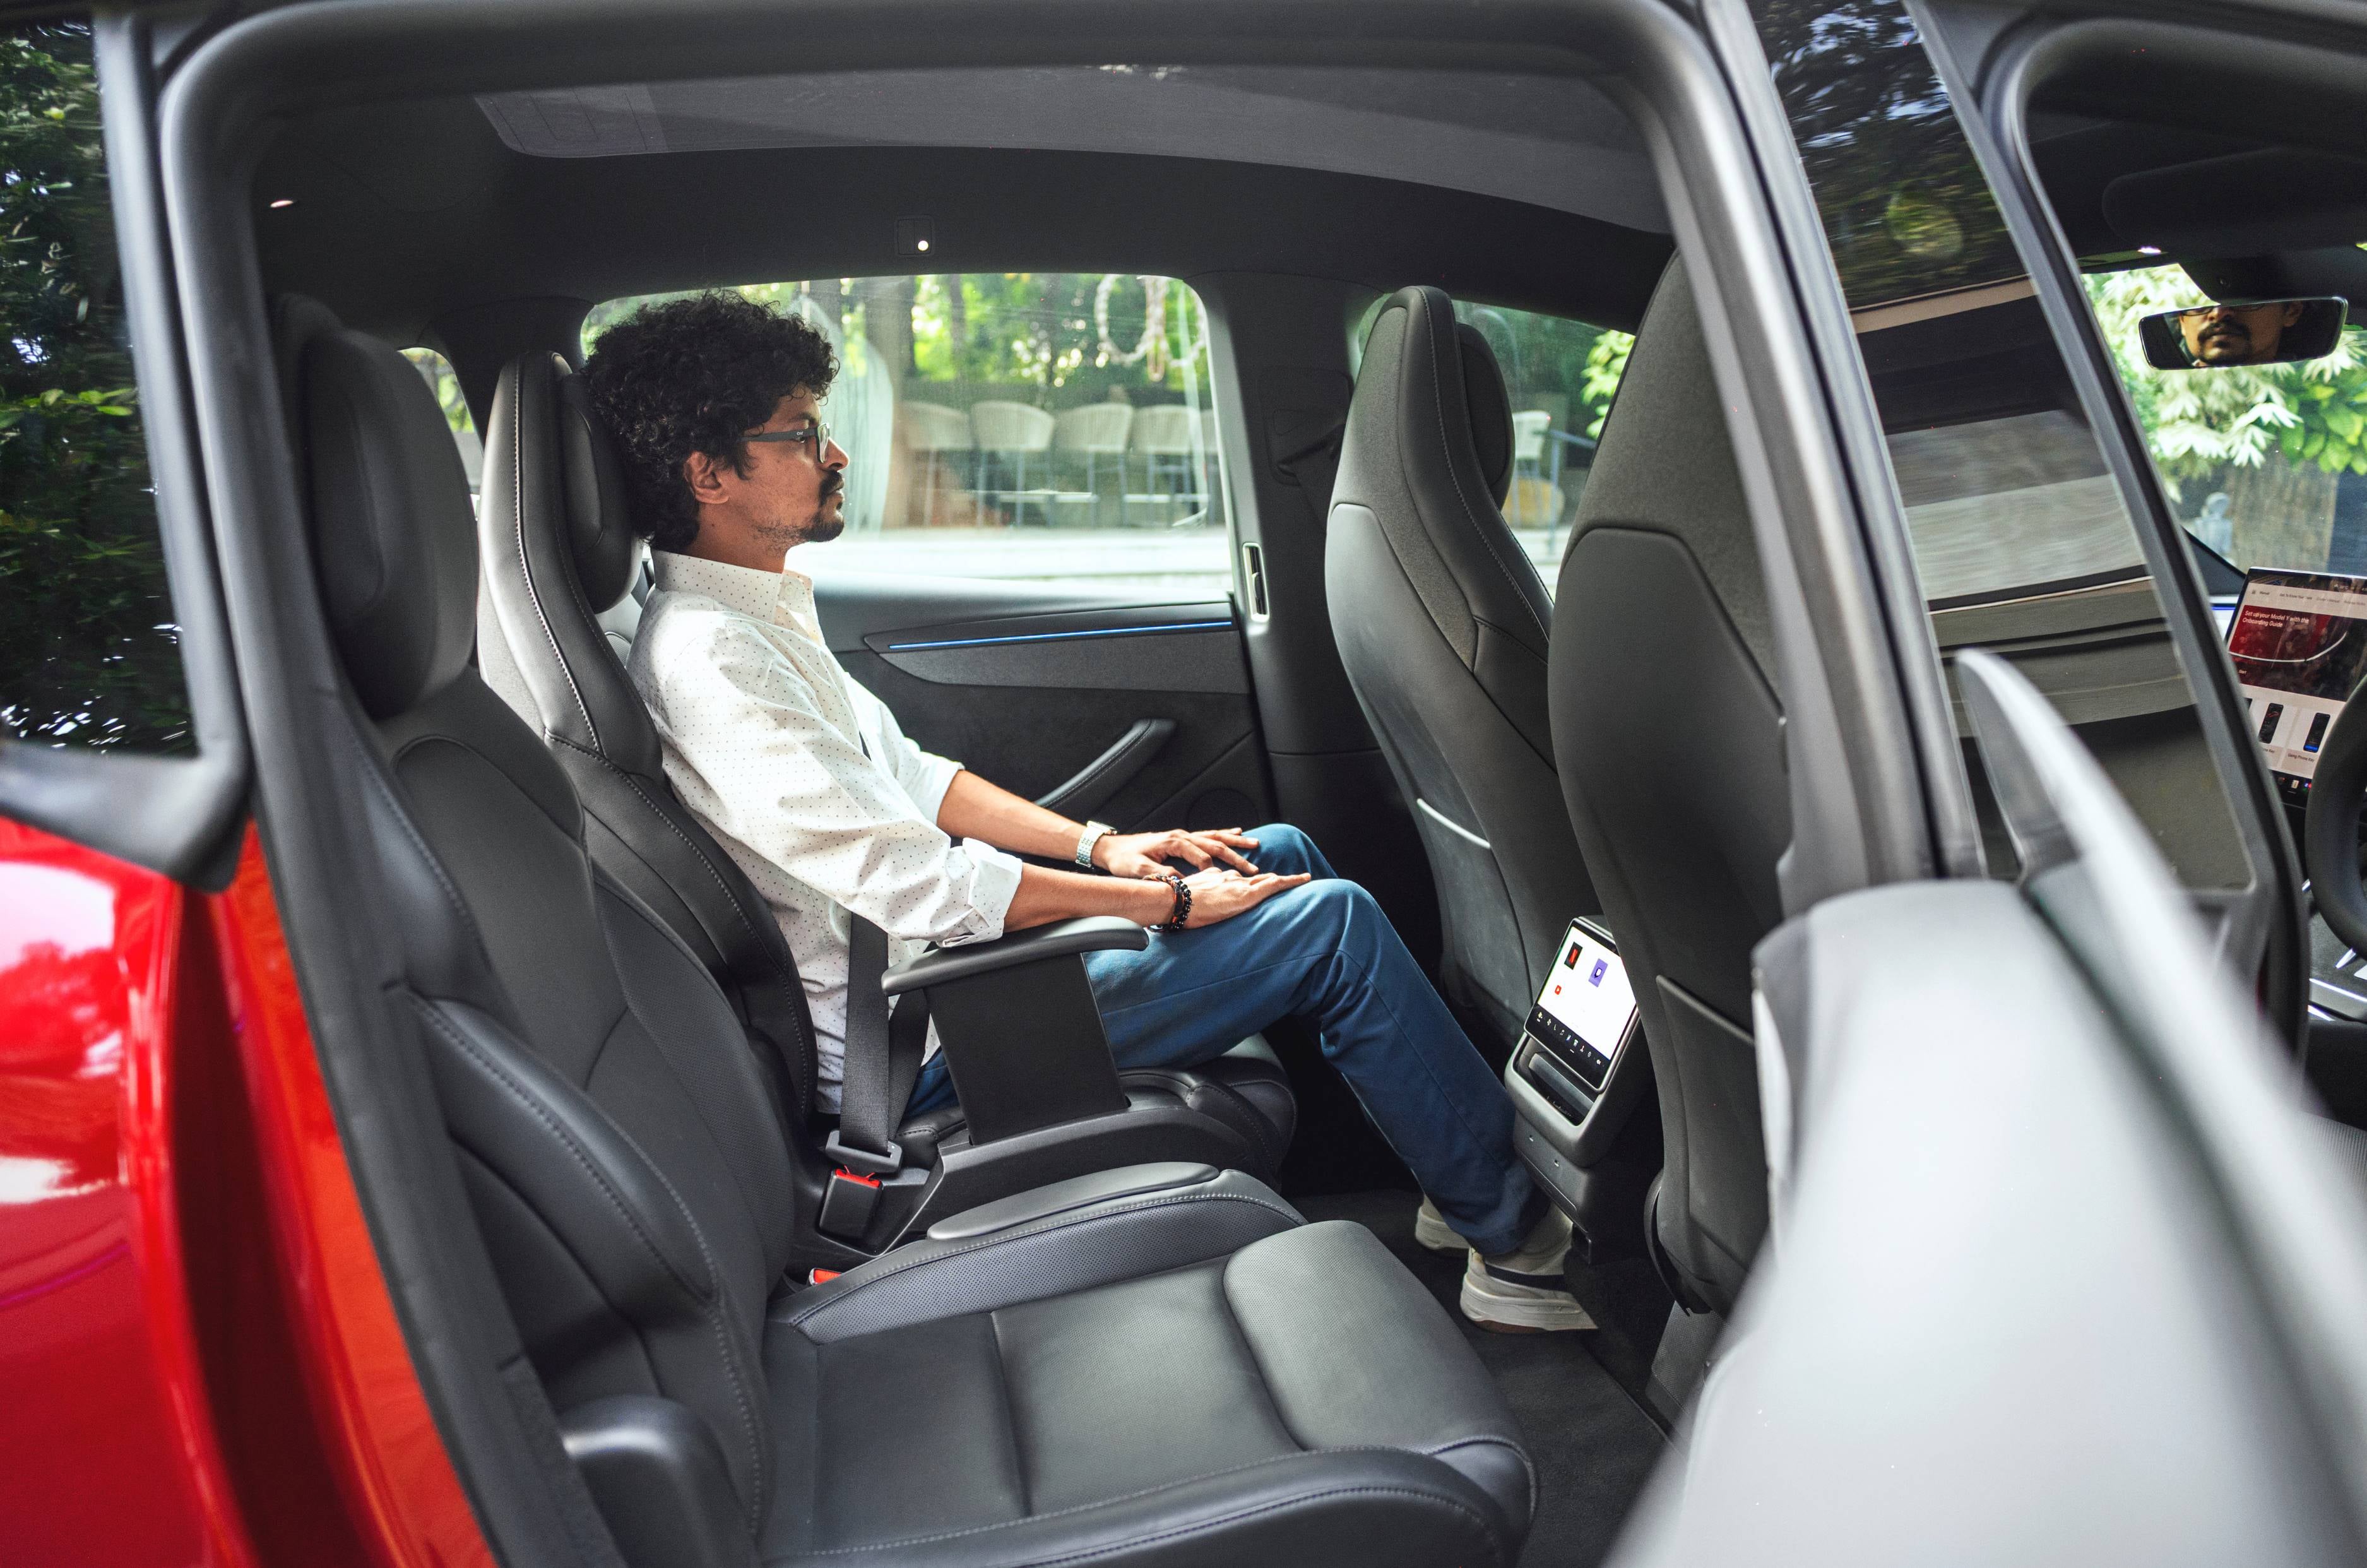
This is where the Model Y L takes a larger step up. The standard Model Y already had a spacious cabin, but the Y L has even more room and brings further versatility, by adding a third row of seats. It is a six-seater rather than a seven-seater, with two individual captain’s chairs in the middle row instead of the standard car’s bench.
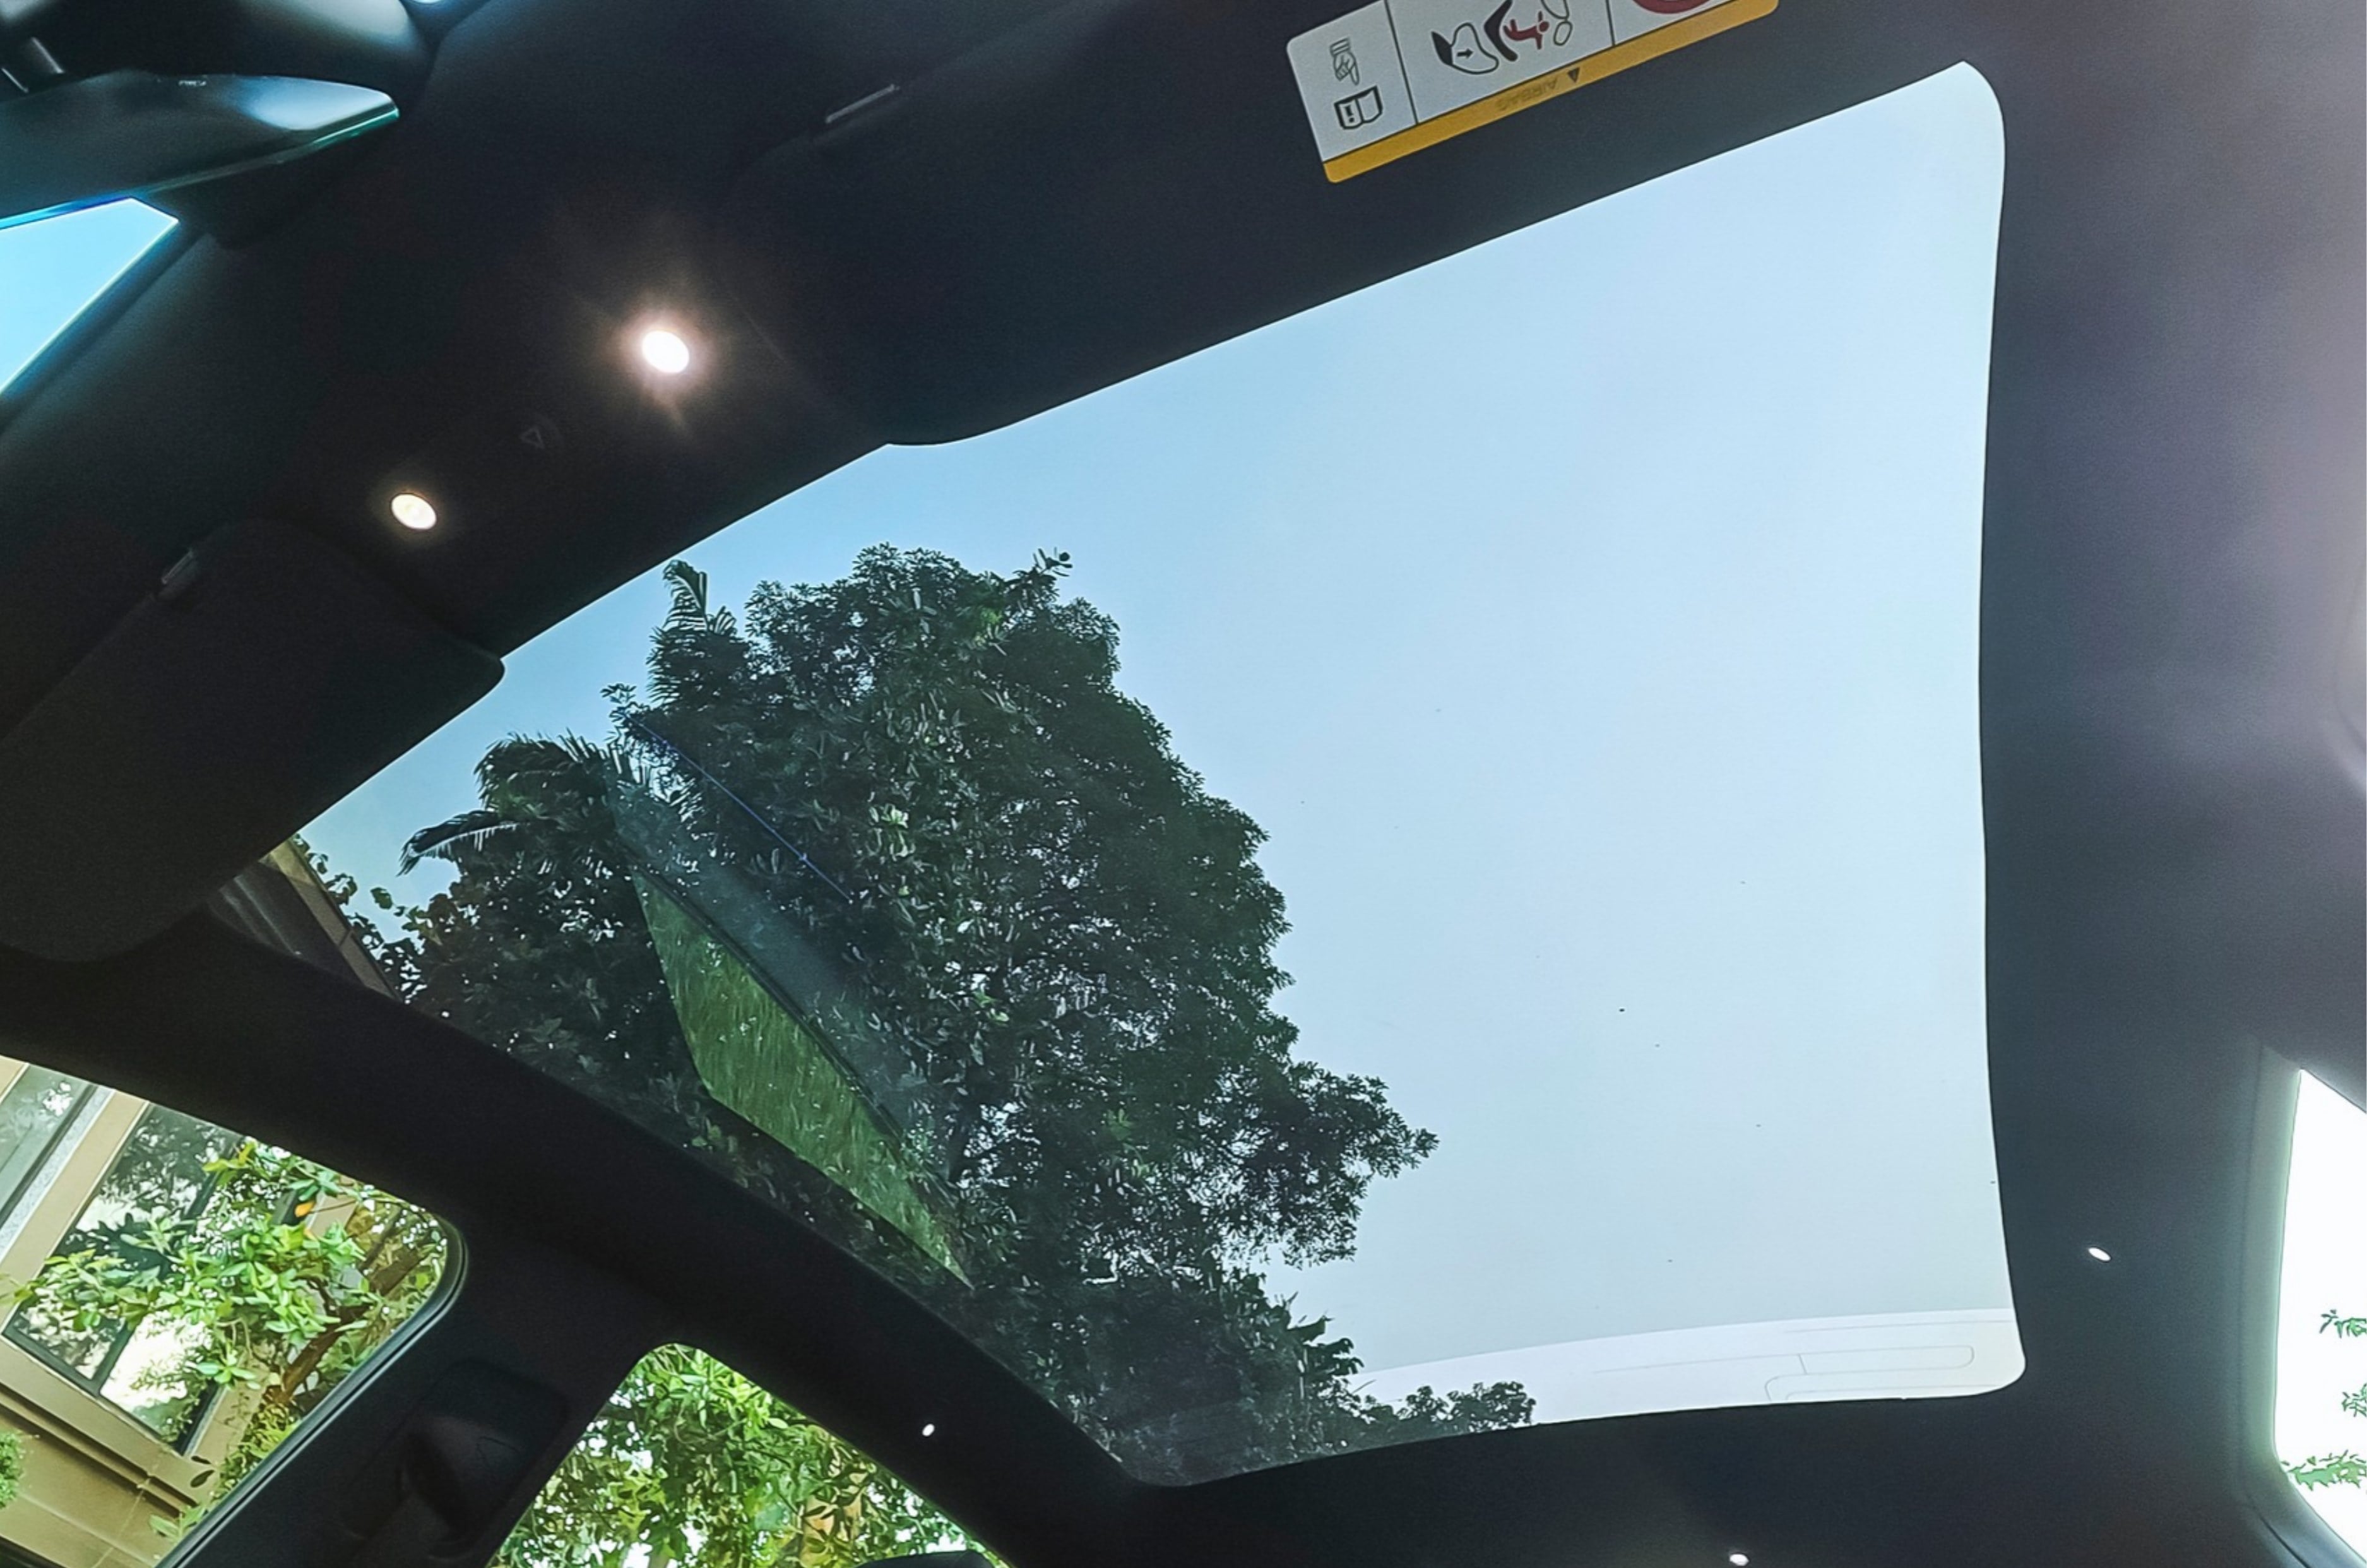
The front seats may be simple-looking but they are plush and comfy, and the extended underthigh support enhances comfort especially for taller people. These seats are also heated, cooled and feature electric adjustment. The second row is arguably the highlight, however. The individual captain’s seats are very comfy, and they feature integrated headrests, a heating and cooling function, along with power adjustment and powered armrests too. The extra wheelbase and taller roof of course gives passengers more room to stretch out and as such there’s no shortage of legroom or headroom here. The larger windows, coupled with the tinted panoramic glass roof further enhances the sense of space. However, since there are no window blinds or a sunshade for the roof, the large glasshouse area means the cabin heats up too easily especially on a hot, sunny day.
Captain seats are very comfy and there’s plenty of legroom and headroom here.
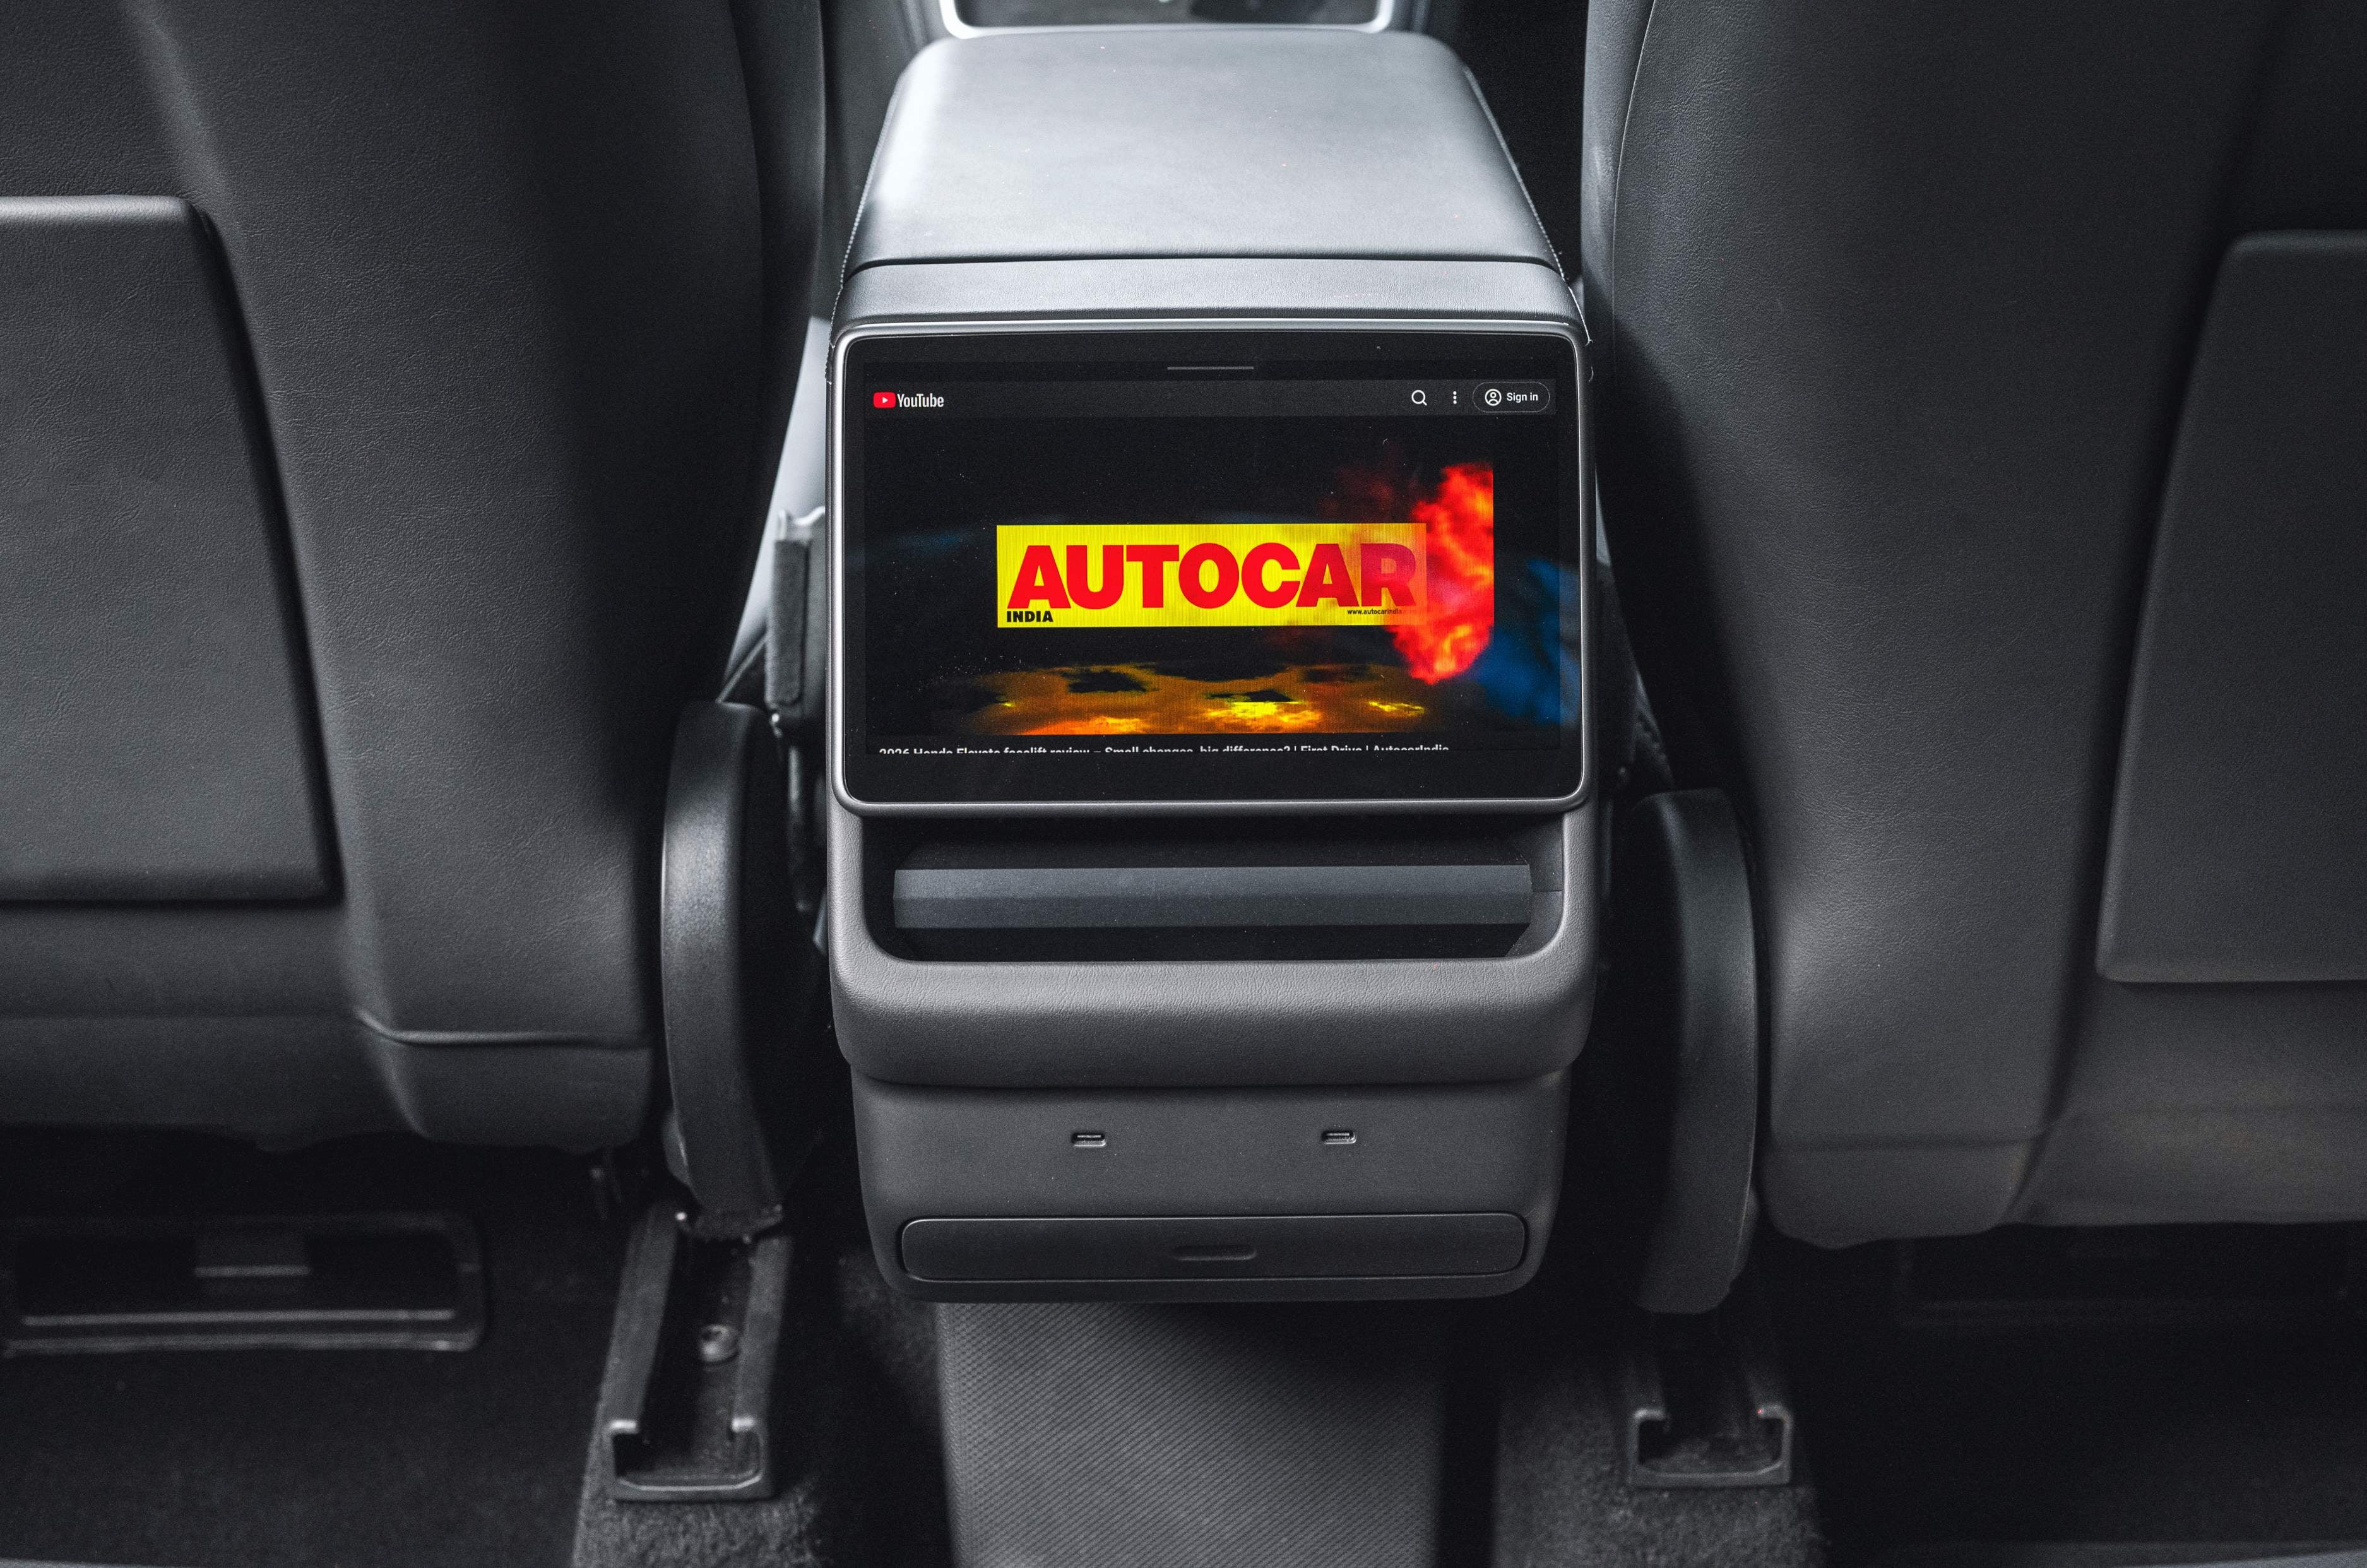
Middle row passengers are well-catered too, however. Apart from the aforementioned heated/cooled and powered seats, you also get cupholders, charging ports, cupholders and a 8-inch touchscreen. This centrally-mounted unit is just as slick to use as the one in the front and it controls several functions, along with the ability to play videos and games.
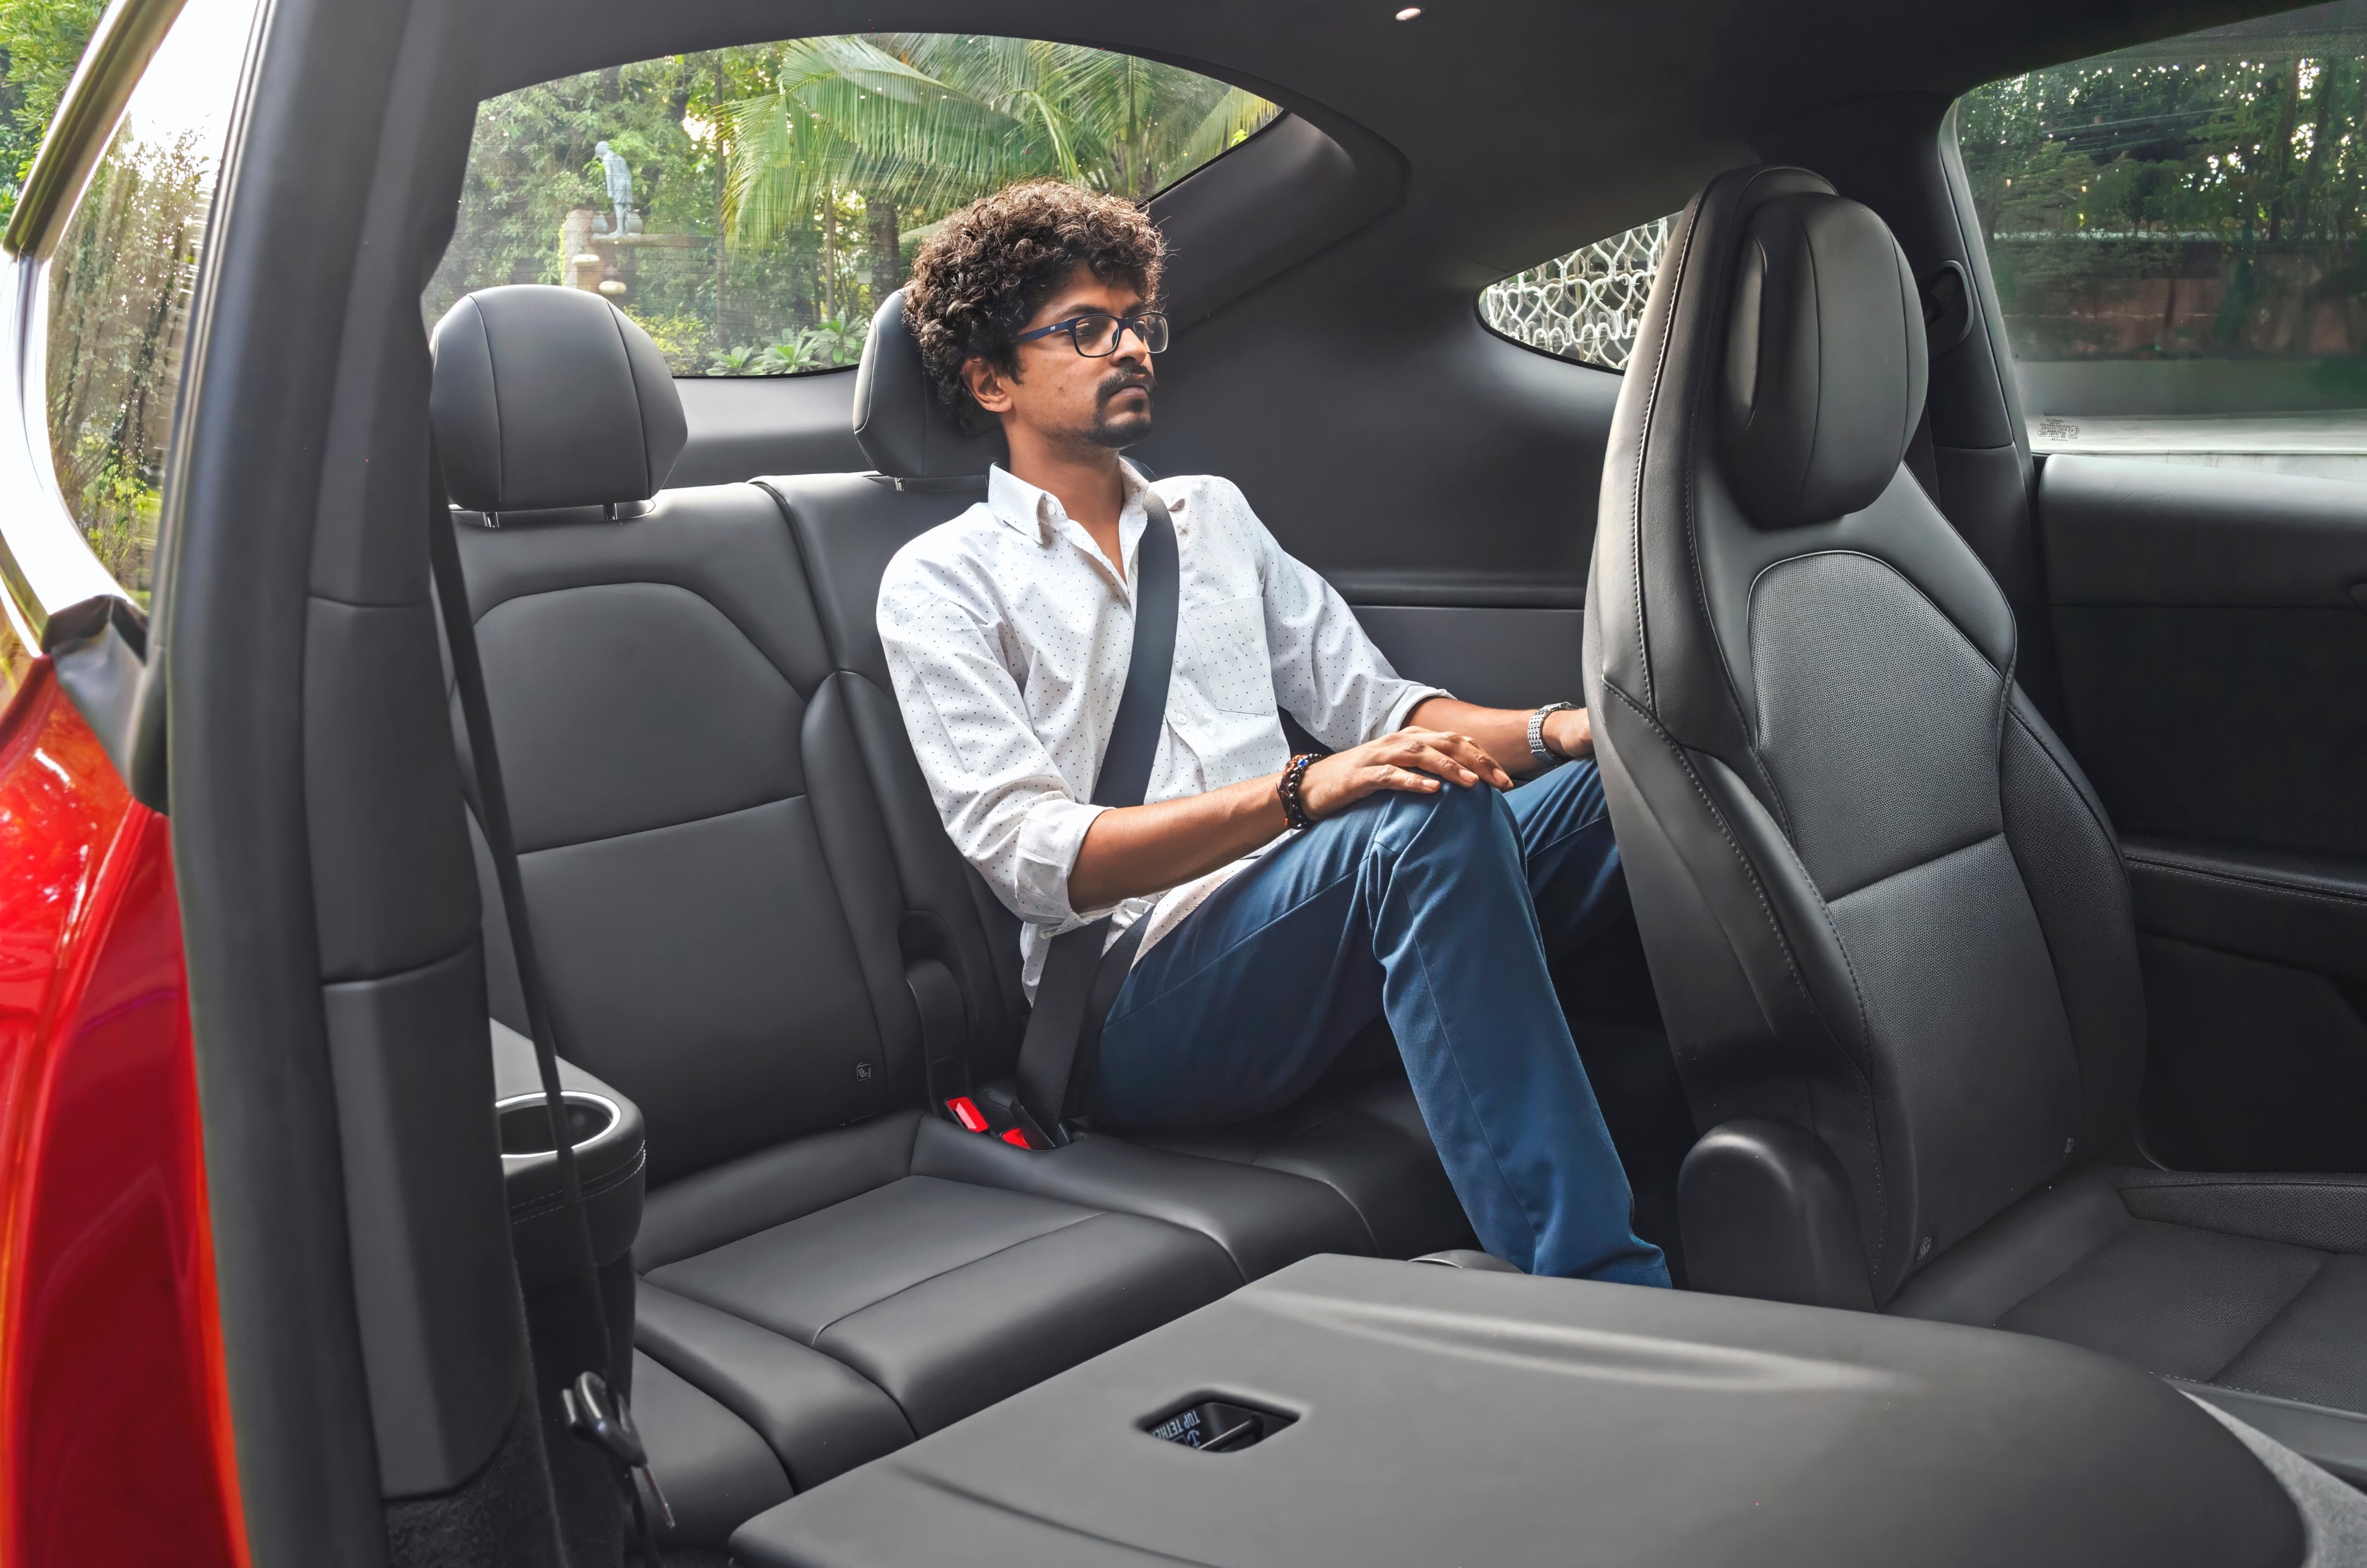
Seating is knees-up, but the third row is usable even for adults.
The third row, however, comes as a bit of a surprise. Considering the low seat, you’re sat in a knees-up position but space back here is genuinely usable for adults, with adequate headroom and kneeroom. Dedicated AC vents, cup holders and type C charging ports are useful inclusions and show that the rearmost seats aren’t simply an afterthought. Like in the middle, here too the large window and untinted rear windscreen lets in a considerable amount of heat.
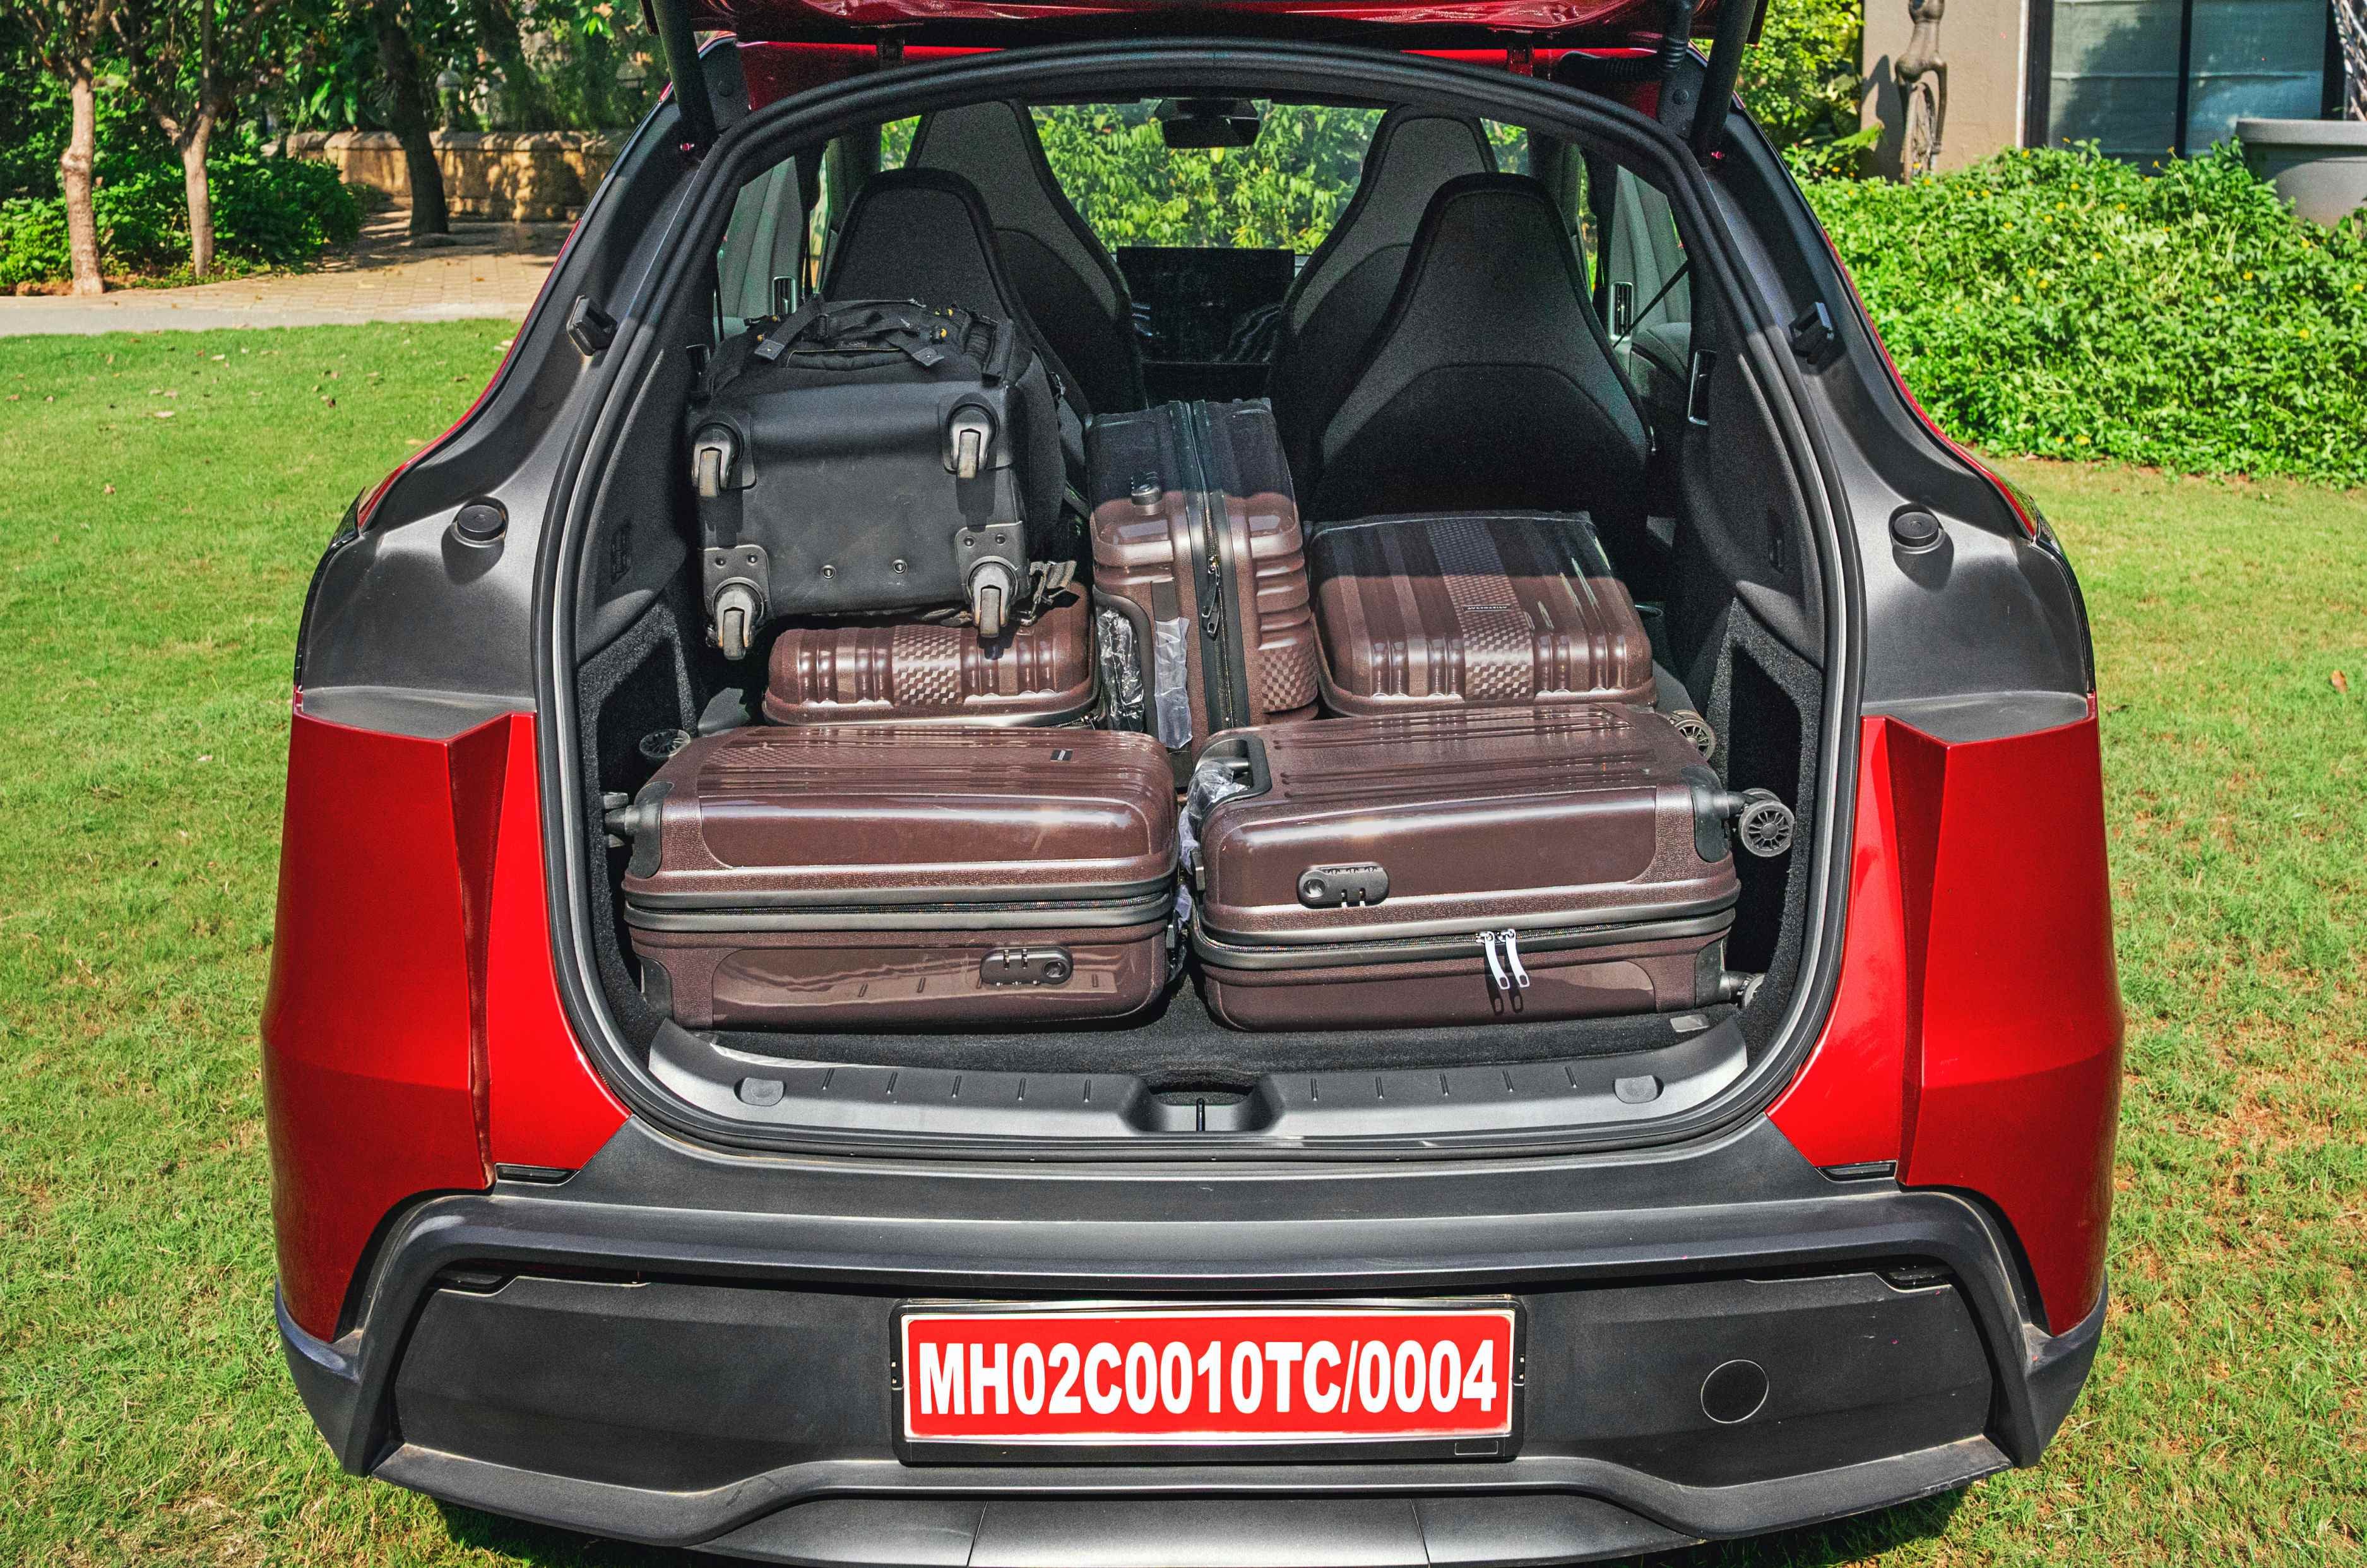
420-litre boot can be expanded to a massive 1,076 litres by folding the third row; more room under the boot floor too.
Luggage space is another important consideration for a family focused car such as the Y L. With all three rows up, boot space is a respectable 420 litres which can be further expanded to a massive 1,076 litres by electronically folding the third row. Then there’s also a considerable amount of storage space under the boot floor and a properly usable 117-litre frunk. As such, the Y L remains practical despite the added seats. It’s worth noting though, there’s no spare wheel.
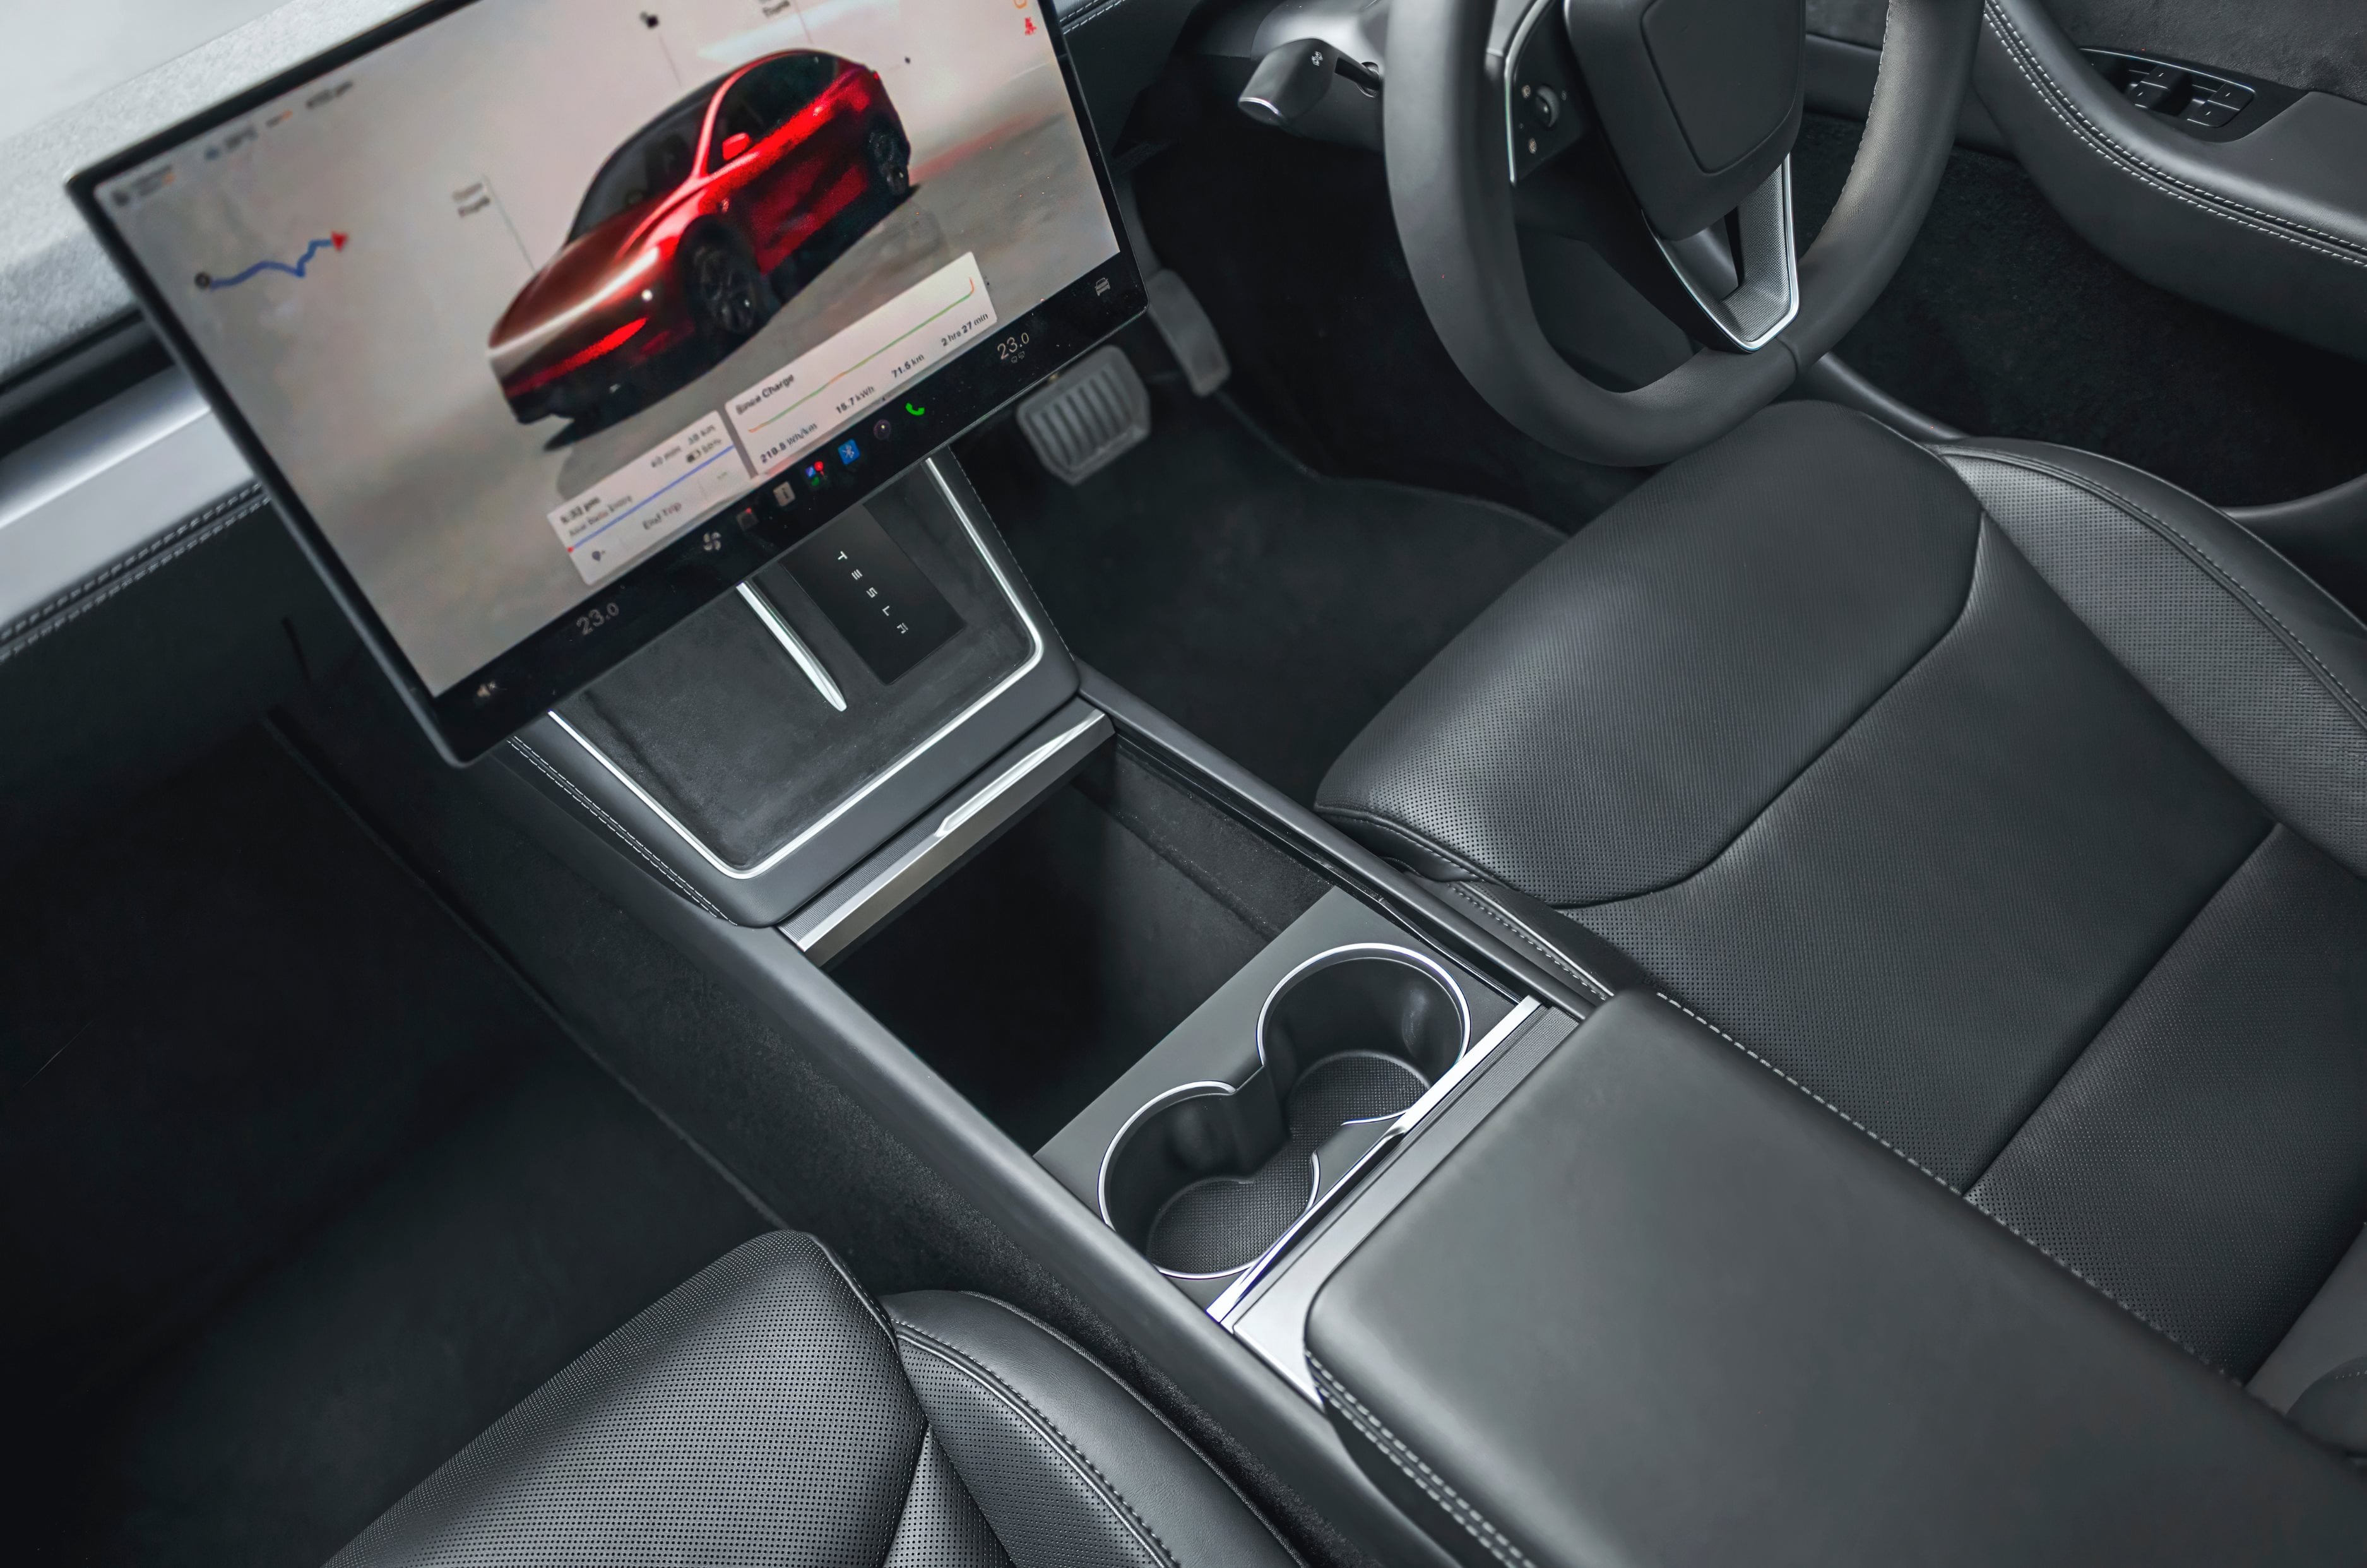
Practical cabin features a large storage box in the centre, cup holders, two wireless phone chargers, and space under the centre armrest.
Up front, the cabin retains Tesla’s familiar minimalist layout. A large central touchscreen dominates the dashboard, with very few physical controls to interrupt the clean design. This extended model gets a textured finish on top of the dashboard, but the overall layout remains largely unchanged. It also remains a practical place, with a large cubby space in the centre console, storage under the centre armrest, multiple cupholders and seat back pockets.
Model Y Features and Safety – 7/10
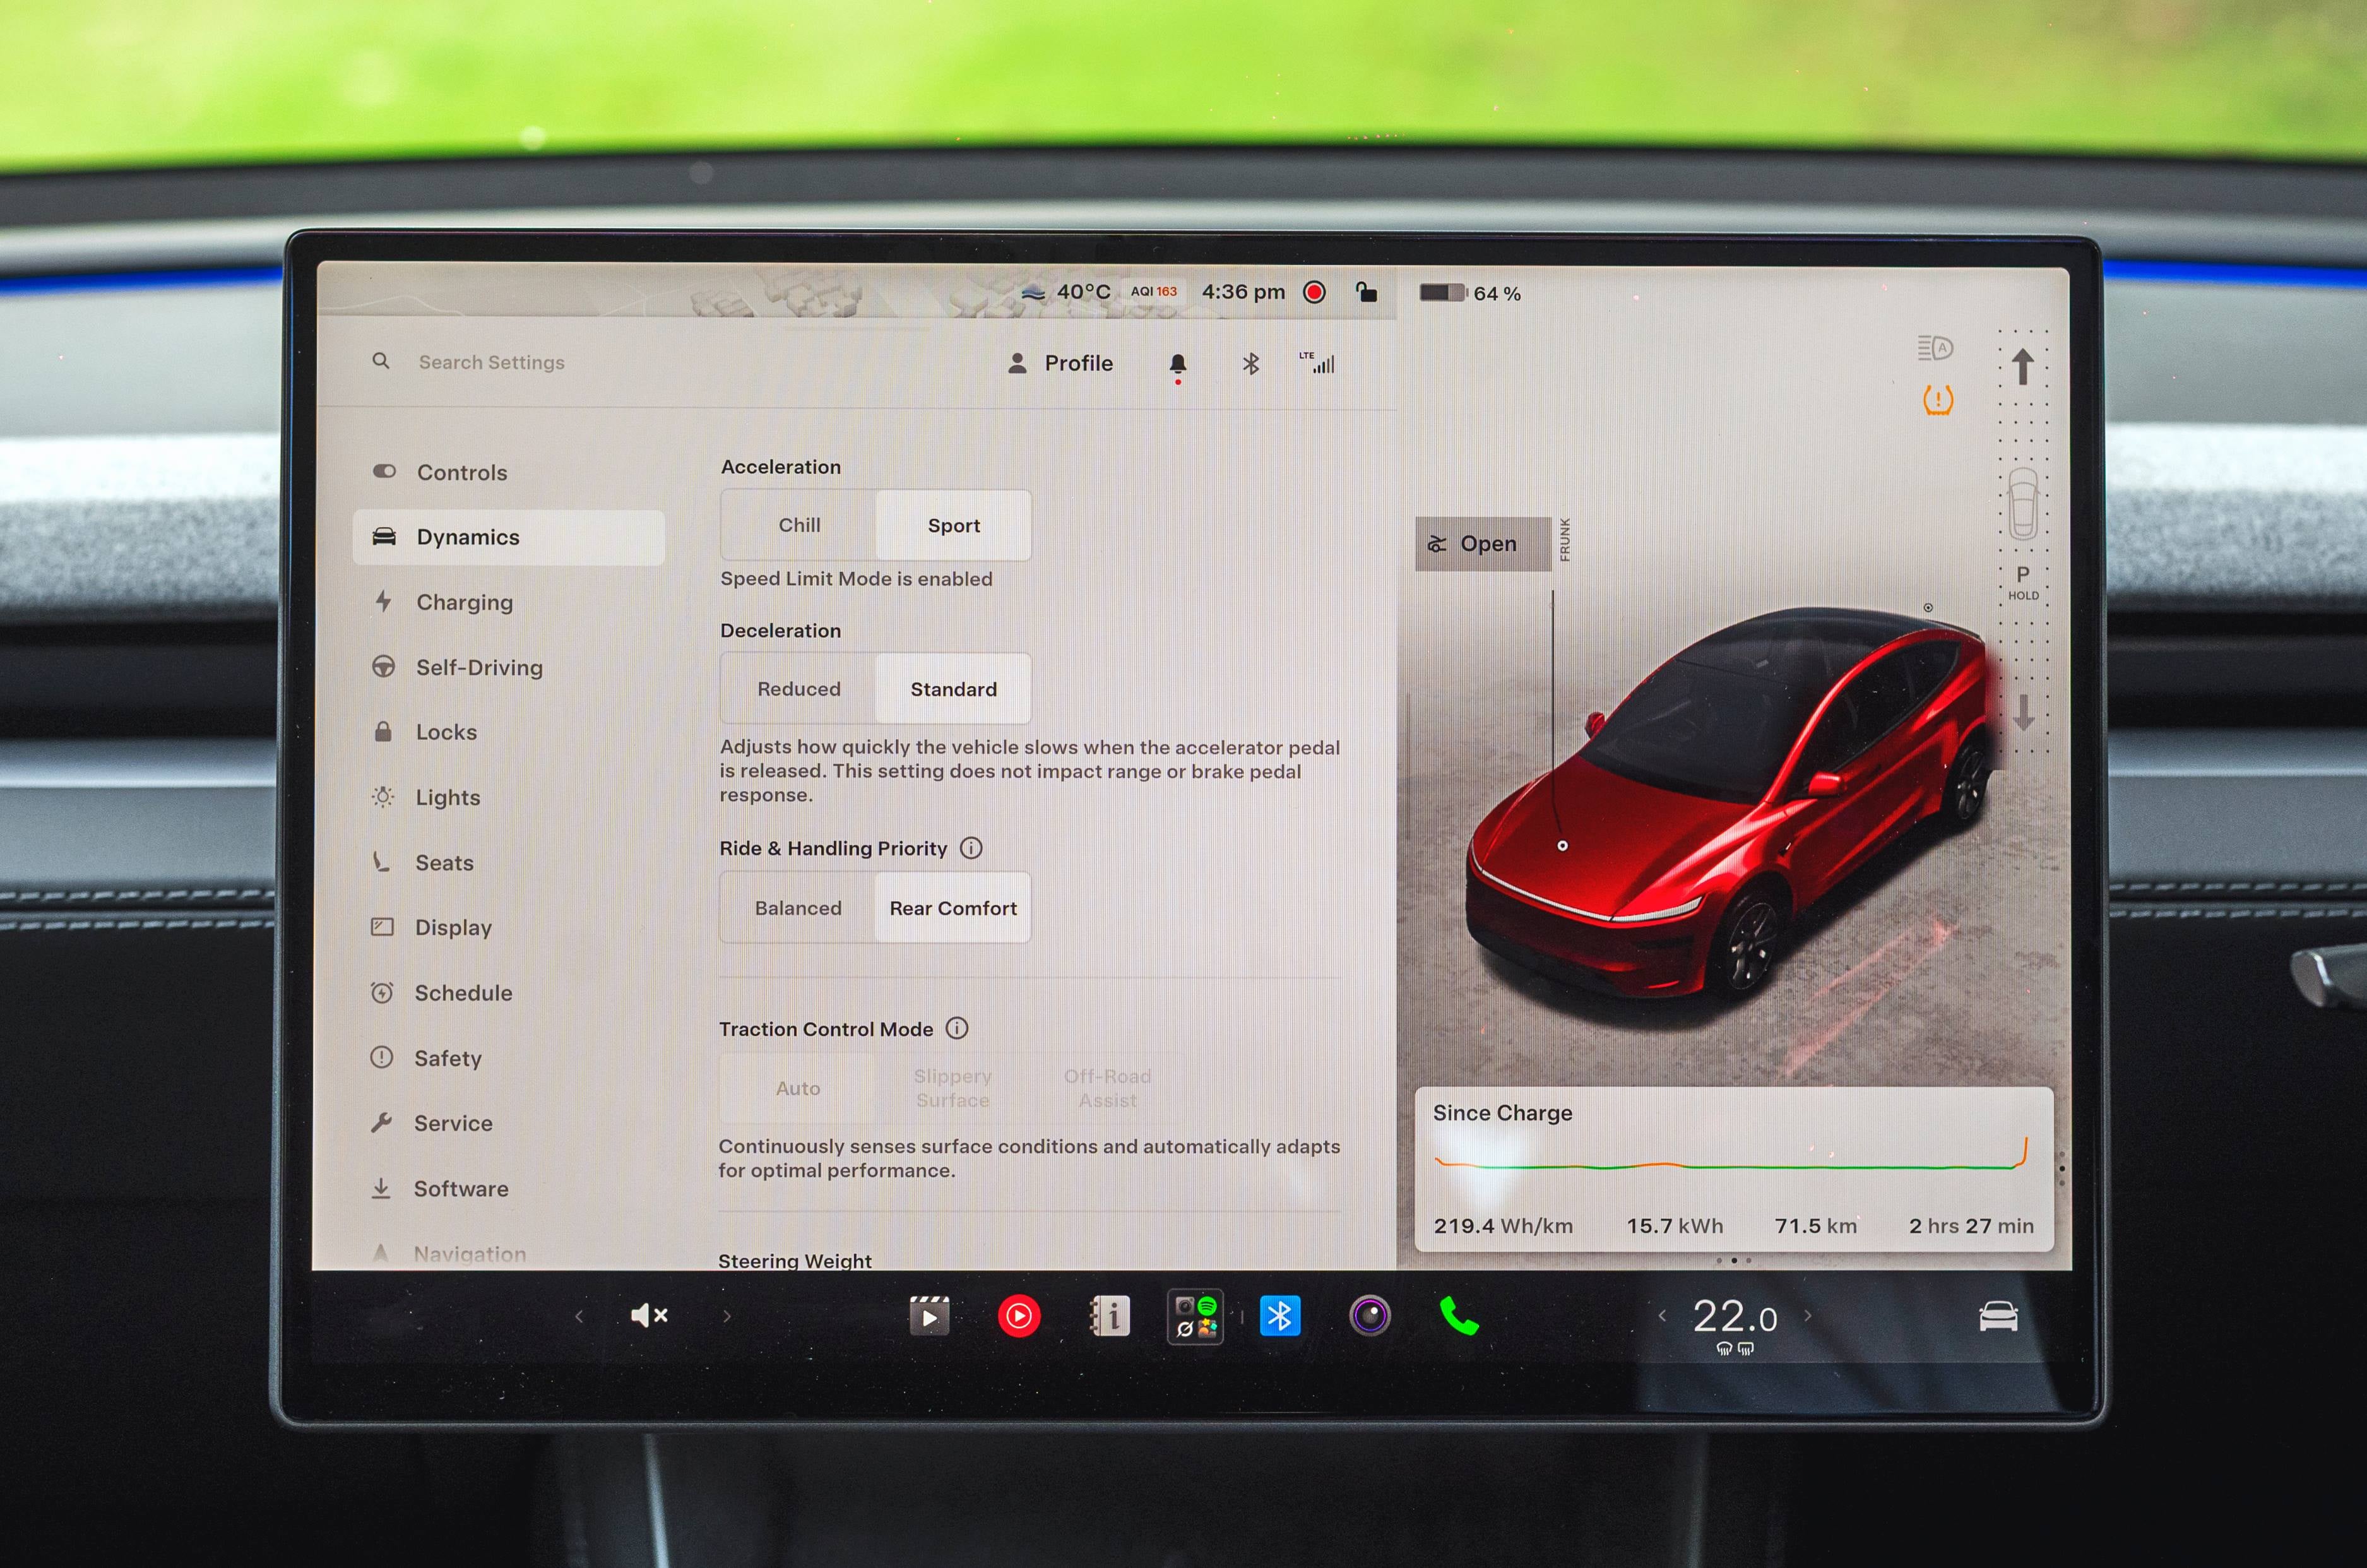
Y L gets a Sport drive mode and two settings for the new adaptive dampers.
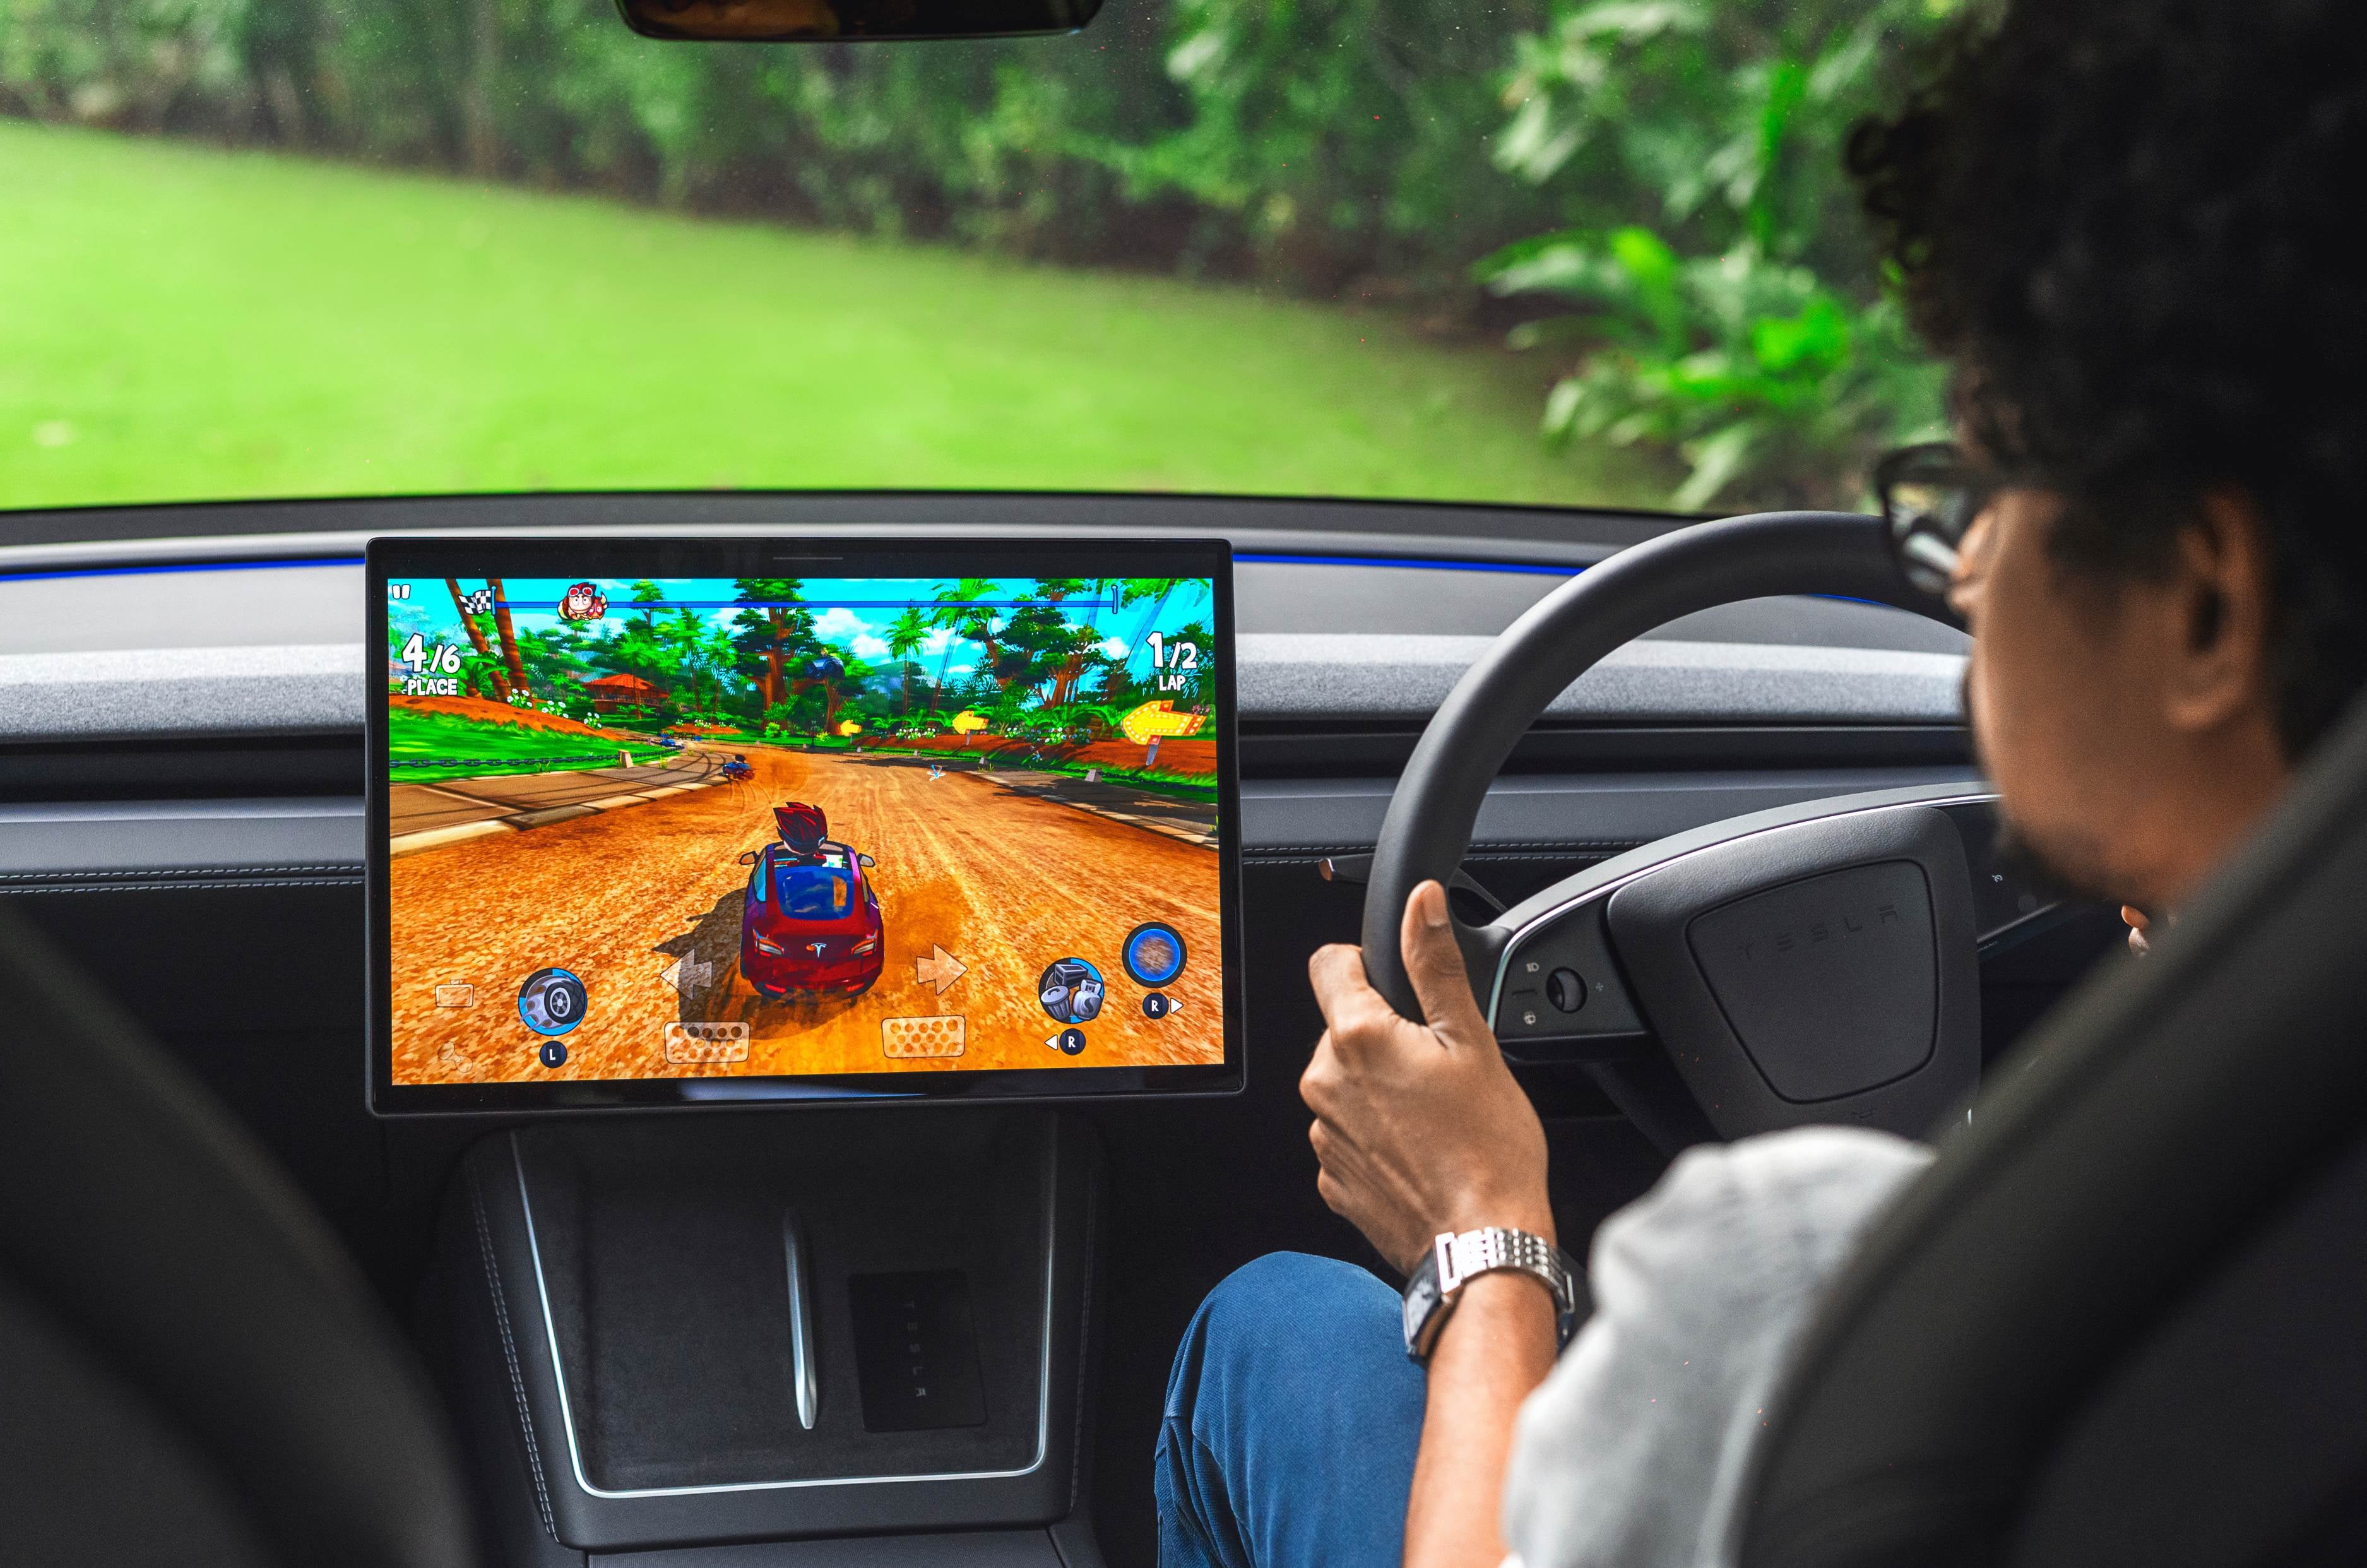
Technology has always been central to Tesla’s appeal, and the Model Y L continues with that approach. Apart from the aforementioned 8-inch rear screen, the main party piece of this car is the central 16-inch touchscreen. This screen is easily one of the best in the business in terms of resolution and responsiveness.
16-inch touchscreen is one of the sharpest around and packs in the typical Tesla quirks and features.
The screen is slick and feature-packed, but the reliance on it for everyday functions remains a usability compromise. Adjusting climate settings and accessing basic vehicle functions like adjusting the mirrors and opening the frunk require navigating menus, which isn’t as intuitive as using dedicated switches. It looks modern and gives the cabin a clean appearance, but a little more emphasis on straightforward ergonomics wouldn’t hurt.
8-inch rear screen is just as slick and can bes used to play videos and control other functions.
But thankfully, you do get the Grok AI assistant as a part of the package which can pretty much do everything for you right from setting the AC, to setting the navigation, finding a charger and much more. It can converse in multiple languages and also constantly learns more about you, so it’s said to get more intuitive as you spend more time with it.
Other features include a panoramic glass roof, dual wireless phone chargers, multi-colour ambient lighting, a superb sounding audio system with 18 speakers and a subwoofer, heated/ventilated and powered front two rows of seats, heated third row seats, all LED lights and so much more. There’s also connected-car tech, and as with any Tesla it gets over-the-air updates, so the car is constantly improving without the need to visit a service centre.
Tinted glass roof helps the cabin feel airy but no sunshade means it heats up quickly as well.
Safety equipment includes nine airbags and a suite of driver-assistance features, including lane-departure warning, lane-keeping assist and blind-spot monitoring. The car also has high-resolution cameras all around it which provide a great view of the surroundings, although Tesla’s more advanced Autopilot capabilities remain absent in India.
The technology is impressive, but the screen-centric interface requires some acclimatisation. Some buyers may find the learning curve frustrating, especially while driving. But for the tech-savvy buyers the Y L is aimed at, they will find this approach very appealing.
Model Y Performance and Refinement – 9/10
Dual-motor, all-wheel-drive powertrain puts out over 500hp and does 0-100kph in a claimed 5 seconds.
The Model Y L is offered in India with a dual-motor all-wheel-drive setup, unlike the rear-wheel-drive only Model Y variants. Tesla does not officially list powertrain specifications, but it has an estimated combined system output of 514hp and 590Nm and the brand claims a 0-100kph time of 5 sec and a top speed of 201kph. We did a quick acceleration test and managed a 0-100kph time of 5.02sec, though we couldn’t test the top speed as our car was electronically limited to 120kph. For a family crossover which is estimated to weigh over two tonnes, the performance is properly brisk. Expectedly, acceleration feels very potent and as typical of any high-performance EV, the Model Y L pins you back into the seat. However, there is a certain progression to the power delivery and the added traction of the all wheel drive setup makes it feel manageable and not overwhelming. There’s also two drive modes, Chill and Sport, the latter of which is exclusive for the Y L. And they have a corresponding effect on the response of the powertrain, with Sport obviously feeling much more immediate.
The added performance also makes overtaking on highways and closing gaps in traffic particularly effortless, as is reflected in the rolling acceleration figures. 20-80kph takes 2.85sec while 40-100kph is dispatched in just 2.94sec.
As with the standard Model Y, the Model Y L also impresses with its refinement. The cabin is superbly insulated from the outside world, thanks in part to the double glazed windows, with barely any road, tyre and wind noise filtering through into the cabin.
Model Y Mileage / Range and Efficiency – 7/10
Tesla Supercharger is said to add up to 288km of range in 15 mins; has a WLTP-rated range of 681km.
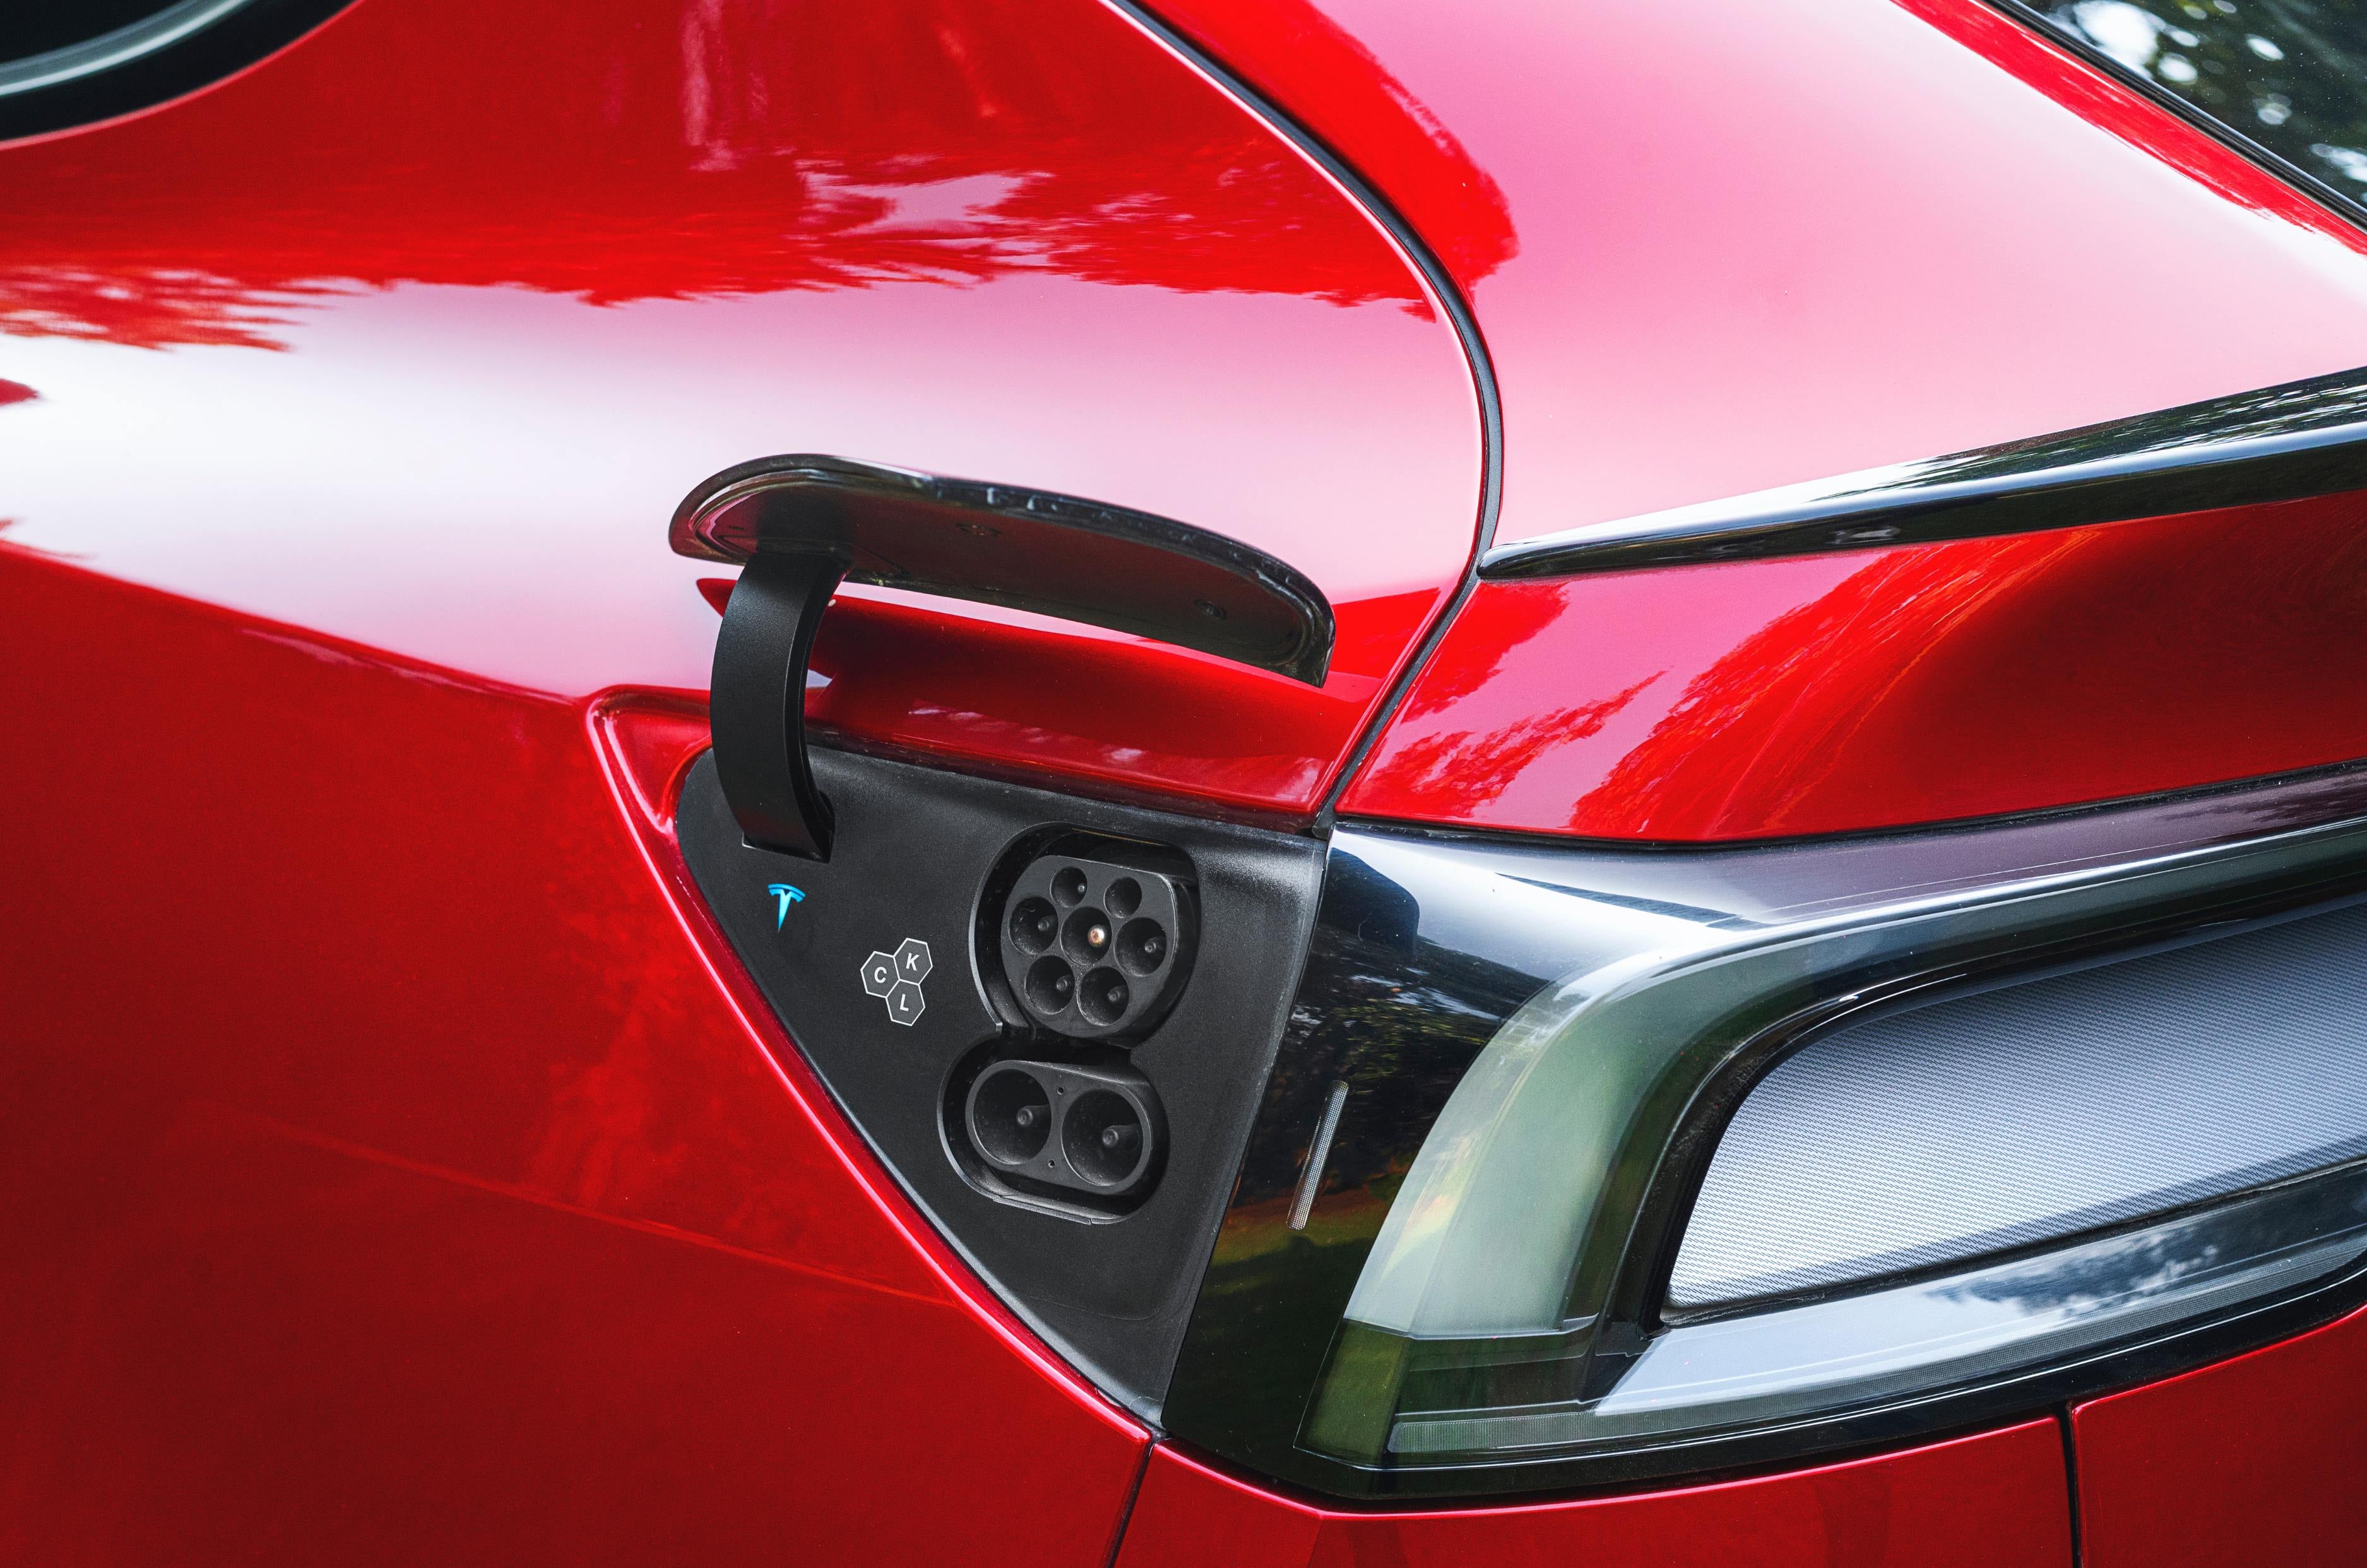
Tesla claims a WLTP range of 681km, from the Model Y L’s 88kWh (estimated) NMC battery pack. That’s more than the standard RWD Model Y, for reference. It can also add up to 288km of range in 15 minutes when connected to a Tesla Supercharger, according to the company. Speaking of which, the electric crossover is capable of accepting up to 250kW on DC fast charging and 11kW on AC charging. As always, real world range will depend on driving conditions, speed, weather and other factors.
Model Y Ride Comfort and Handling – 7/10
Adaptive dampers and longer wheelbase does make the Y L feel more settlled than the standard Model Y.
The standard Model Y’s ride and handling package is competent, although its low-speed ride is noticeably firm, especially on uneven surfaces. Tesla has made changes to the L’s suspension, equipping it with adaptive dampers in a bid to improve comfort and body control.
This is a particularly relevant upgrade for a longer, heavier vehicle designed to carry more passengers. As with everything else, this is also controlled via the touchscreen with two settings available – Balanced and Rear Comfort. The latter softens things down and gives it a slightly plusher feel, while the former represents a good middle ground between ride comfort and handling. Even though the difference in the modes isn’t that great, the Y L does feel more composed over broken roads and avoids transmitting as much movement into the cabin as the Standard Model Y.
The longer wheelbase also helps the car feel a bit more settled at speed, although manoeuvring in confined spaces is more cumbersome, and this is particularly amplified thanks to the rather poor turning circle. Like the standard Model Y’s, the Y L’s steering is light and easy to use, but it isn’t particularly feelsome. There’s also three modes for the steering, which progressively add more weight. The handling too is more competent and predictable rather than entertaining. It doesn’t feel as agile as the Model Y but body movements do seem better controlled thanks to the adaptive dampers.
There’s two levels of regenerative braking – Standard and Reduced. Standard is the stronger setting and best for use in the city as it almost functions like a one-pedal mode while Reduced is for highway use as it allows for some coasting.
Model Y Value for Money – 7/10
The Model Y L is for those who want a spacious, quick, refined, and cutting-edge premium EV for the family.
Priced at Rs 61.99 lakh (ex-showroom), the Tesla Model Y L makes for a more compelling case than the standard Model Y despite costing 10 lakh more. It still costs a fair bit more than its most direct rivals, the BMW iX1 LWB and the BYD Sealion 7, but the Y L is more spacious with more seats. The Model Y L does have its compromises though. It’s over reliant on the touchscreen for even basic functions and the large glasshouse means the cabin heats up easily. The larger dimensions, poor turning circle, low ground clearance and long wheelbase also means it is more challenging to maneuver in the city and while parking.
But it brings a lot more to the table too. There’s more cabin space, the added versatility of a third row, a more potent dual-motor powertrain with all-wheel-drive and a higher claimed range as well. And it retains its strengths of being featured-packed, with excellent refinement and massive cargo space. Tesla says that buyers are now preferring to opt for the Y L over the Model Y considering all the additional things it brings, and that really doesn’t come as a surprise. So for buyers who want a spacious, quick, refined and cutting-edge electric crossover for the family, the Tesla Model Y L fits the bill perfectly.
September CPI : सितंबर में भारत की रिटेल महंगाई दर बढ़कर 5.54 प्रतिशत हो गई। नई कंज्यूमर प्राइस इंडेक्स (CPI) सीरीज़ में यह पहली बार है जब महंगाई दर 5 प्रतिशत के स्तर से ऊपर गई है। खाने-पीने की चीजों की कीमतों में तेज बढ़ोतरी का इस बढ़त में सबसे ज्यादा योगदान रहा है, जिससे परिवारों का खर्च काफी बढ़ गया है। आज 12 अक्टूबर को आए आंकड़ों के मुताबिक अगस्त में महंगाई दर 4.83 प्रतिशत थी, जिसमें बढ़ोतरी हुई है। यह मार्च के बाद से सालाना महंगाई दर में लगातार छठी मासिक बढ़ोतरी है।
इस बढ़ोतरी के साथ महंगाई दर भारतीय रिज़र्व बैंक के 4 प्रतिशत के लक्ष्य से ऊपर चली गई, हालांकि यह केंद्रीय बैंक की 2-6 प्रतिशत की स्वीकार्य सीमा के भीतर ही रही है।
खाने-पीने की चीजो की महंगाई सबसे ज्यादा बढ़ी
कंज्यूमर फ़ूड प्राइस इंडेक्स (CFPI) के हिसाब से, खाने-पीने की चीज़ों की महंगाई अगस्त में 5.97 प्रतिशत से बढ़कर सितंबर में 7.74 प्रतिशत हो गई। प्याज़ की कीमतों में सबसे ज़्यादा बढ़ोतरी दर्ज की गई है। अगस्त में इसकी महंगाई दर 48.78 प्रतिशत थी, जो सितंबर में बढ़कर 108.09 प्रतिशत हो गई। लहसुन की महंगाई दर 43.60 प्रतिशत से बढ़कर 54.62 प्रतिशत हो गई, जबकि नींबू की कीमतों में 36.41 प्रतिशत की बढ़ोतरी हुई, जो पिछले महीने 15.15 प्रतिशत थी।
हालांकि, कुछ सब्जियों में राहत मिली। आलू की कीमतों में सालाना 11.50 प्रतिशत की गिरावट आई, जबकि टमाटर की कीमतें 8.62 प्रतिशत कम हुईं। चांदी के गहनों में महंगाई दर 87.80 प्रतिशत के बहुत ऊंचे स्तर पर बनी रही, हालांकि अगस्त में यह 106.81 प्रतिशत थी। सितंबर में पान-तंबाकू की महंगाई 4.71% से बढ़कर 4.8% पर रही। वहीं, फूड एंड बेवरेजेज महंगाई 5.66% से बढ़कर 7.36% पर रही।
ग्रामीण इलाकों में महंगाई 6 प्रतिशत के पार
ग्रामीण भारत में महंगाई में ज़्यादा तेज़ी देखी गई। सितंबर में ग्रामीण भारत की खुदरा महंगाई अगस्त के 5.24 प्रतिशत से बढ़कर 6.08 प्रतिशत हो गई। शहरी इलाकों में महंगाई 4.31 प्रतिशत से बढ़कर 4.88 प्रतिशत हो गई। इसके चलते ग्रामीण और शहरी महंगाई के बीच का अंतर बढ़कर 1.20 प्रतिशत हो गया, जबकि अगस्त में यह 0.93 प्रतिशत था।
बड़े राज्यों में, तमिलनाडु की रिटेल महंगाई दर 6.81 प्रतिशत दर्ज की गई, इसके बाद ओडिशा में 6.70 प्रतिशत, मध्य प्रदेश में 6.68 प्रतिशत, तेलंगाना में 6.64 प्रतिशत और आंध्र प्रदेश में 6.29 प्रतिशत रही।
कीमतों का दबाव सिर्फ़ खाने-पीने की चीज़ों तक ही सीमित नहीं
ताज़ा आंकड़ों से कई तरह की सेवाओं और खाने-पीने से जुड़ी चीज़ों के अलावा अन्य कैटेगरी में भी महंगाई बढ़ने का पता चलता है। पर्सनल केयर, मिसिलेनियस महंगाई घटकर 13.75% पर रही है। वहीं, रेस्टोरेंट,एकॉमडेशन सर्विस महंगाई बढ़कर 9.36% पर रही है। एजुकेशन सर्विसेस महंगाई 3.73% से बढ़कर 3.94% पर रही है।
सितंबर में रिक्रिएशन, स्पोर्ट & कल्चर महंगाई बढ़कर 2.16 प्रतिशत पर आ गई। वहीं, इंफो, कम्युनिकेशन महंगाई 2.01 प्रतिशत से बढ़कर 2.44 प्रतिशत पर रही। सितंबर रिटेल महंगाई दर 23 महीने के ऊपरी स्तर पर रही है। ट्रांसपोर्टेशन महंगाई दर 4.60 प्रतिशत से बढ़कर 5.01 प्रतिशत पर आ गई है। वहीं, हेल्थ महंगाई दर 1.34 प्रतिशत से बढ़कर 1.40 प्रतिशत पर रही है। फर्निशिंग, घरेलू उपकरण महंगाई दर 3.11 न पर रही है। हाउसिंग यूटिलिटी महंगाई 2.61प्रतिशत से बढ़कर 2.74 प्रतिशत पर रही है। वहीं, कपड़ा, जूता चप्पल महंगाई 3.56 प्रतिशत से बढ़कर 3.93 प्रतिशत पर रही है।
मॉनेटरी पॉलिसी पर असर
सितंबर में महंगाई के आंकड़े RBI के लिए एक चुनौती हैं, क्योंकि मार्च से कीमतों में लगातार बढ़ोतरी के कारण हेडलाइन महंगाई दर, RBI की तय सीमा (टॉलरेंस बैंड) के ऊपरी स्तर के करीब पहुंच गई है।
इन दबावों का बने रहना RBI के भविष्य के पॉलिसी फैसलों के लिए अहम होगा। अब यह देखना होगा कि क्या खाने-पीने की चीजों की महंगाई में बढ़ोतरी कुछ समय के लिए है या यह आम कंज्यूमर कीमतों पर भी इसका असर दिखने लगा है। RBI एमपीसी की अगली बैठक दिसंबर में होगी।
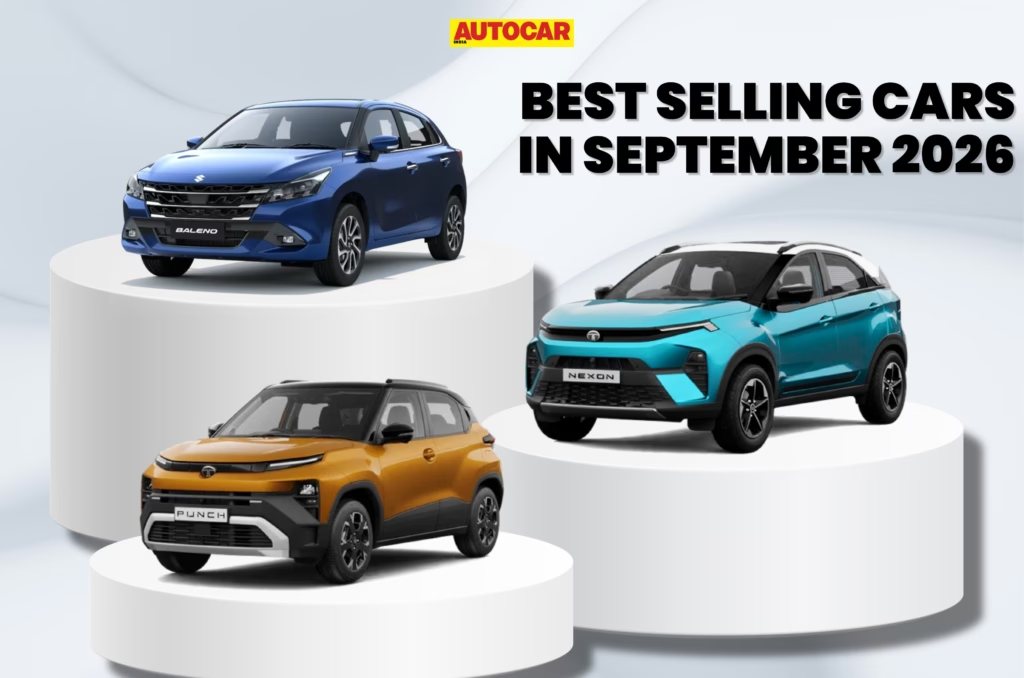
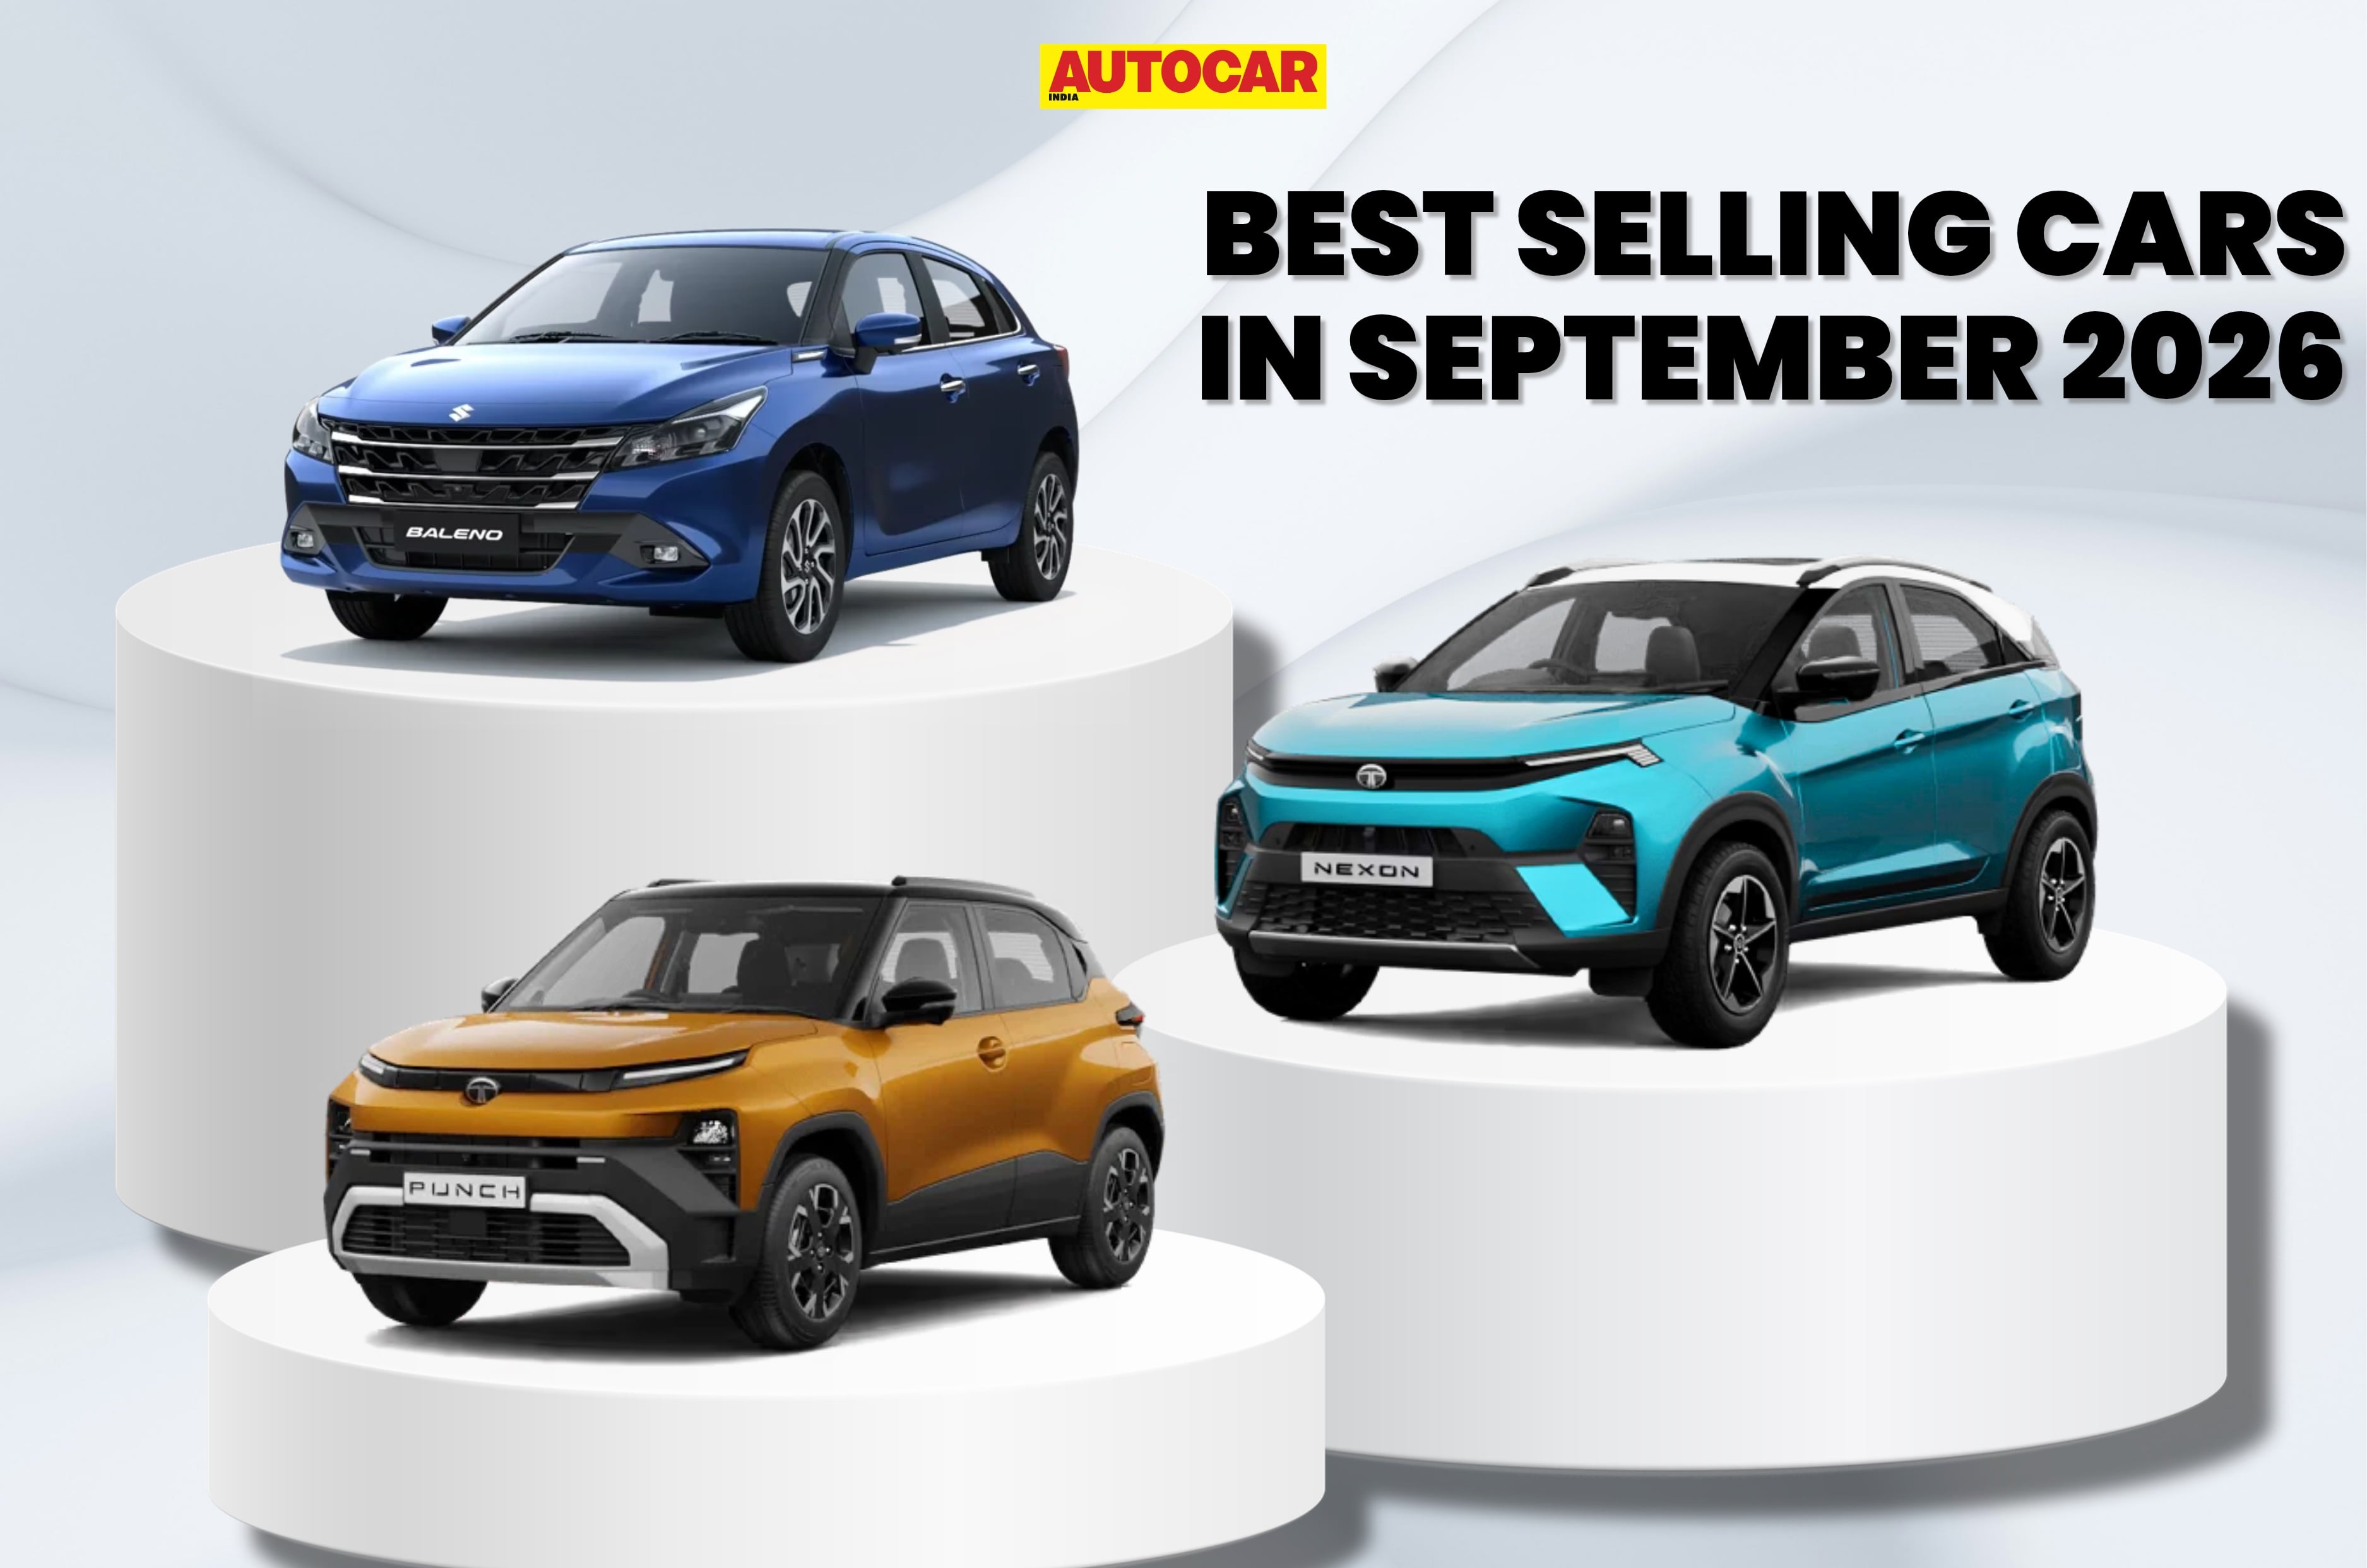
September 2026 saw the Maruti Suzuki Baleno top the best-selling cars list with 25,392 units dispatched, a 93 percent increase year on year. The Tata Nexon and Punch ranked second and third, respectively, with over 20,000 units each. Combined dispatches of the top 10 models rose 15.5 percent to 1,91,332 units. Maruti Suzuki had six models on the list, followed by Tata Motors with two, and Hyundai and Mahindra with one each.
Top 10 best-selling cars in September 2026
Rank
Model
Sep 2026 sales (units)
Aug 2026 sales (units)
Sep 2025 sales (units)
MoM change (%)
YoY change (%)
1
Maruti Baleno
25,392
15,376
13,173
+61
+93
2
Tata Nexon
20,456
18,431
22,573
+11
-9
3
Tata Punch
20,333
21,320
15,891
-5
+28
4
Maruti Fronx
19,282
18,730
13,767
+3
+40
5
Maruti Wagon R
18,835
20,180
15,388
-7
+22
6
Maruti Dzire
17,754
18,418
20,038
-4
-11
7
Hyundai Creta
17,657
16,288
18,861
+8
-6
8
Maruti Swift
17,399
19,832
15,547
-12
+12
9
Mahindra Scorpio
17,313
15,576
18,372
+11
-6
10
Maruti Ertiga
16,911
18,516
12,115
-9
+40
1. Maruti Suzuki Baleno
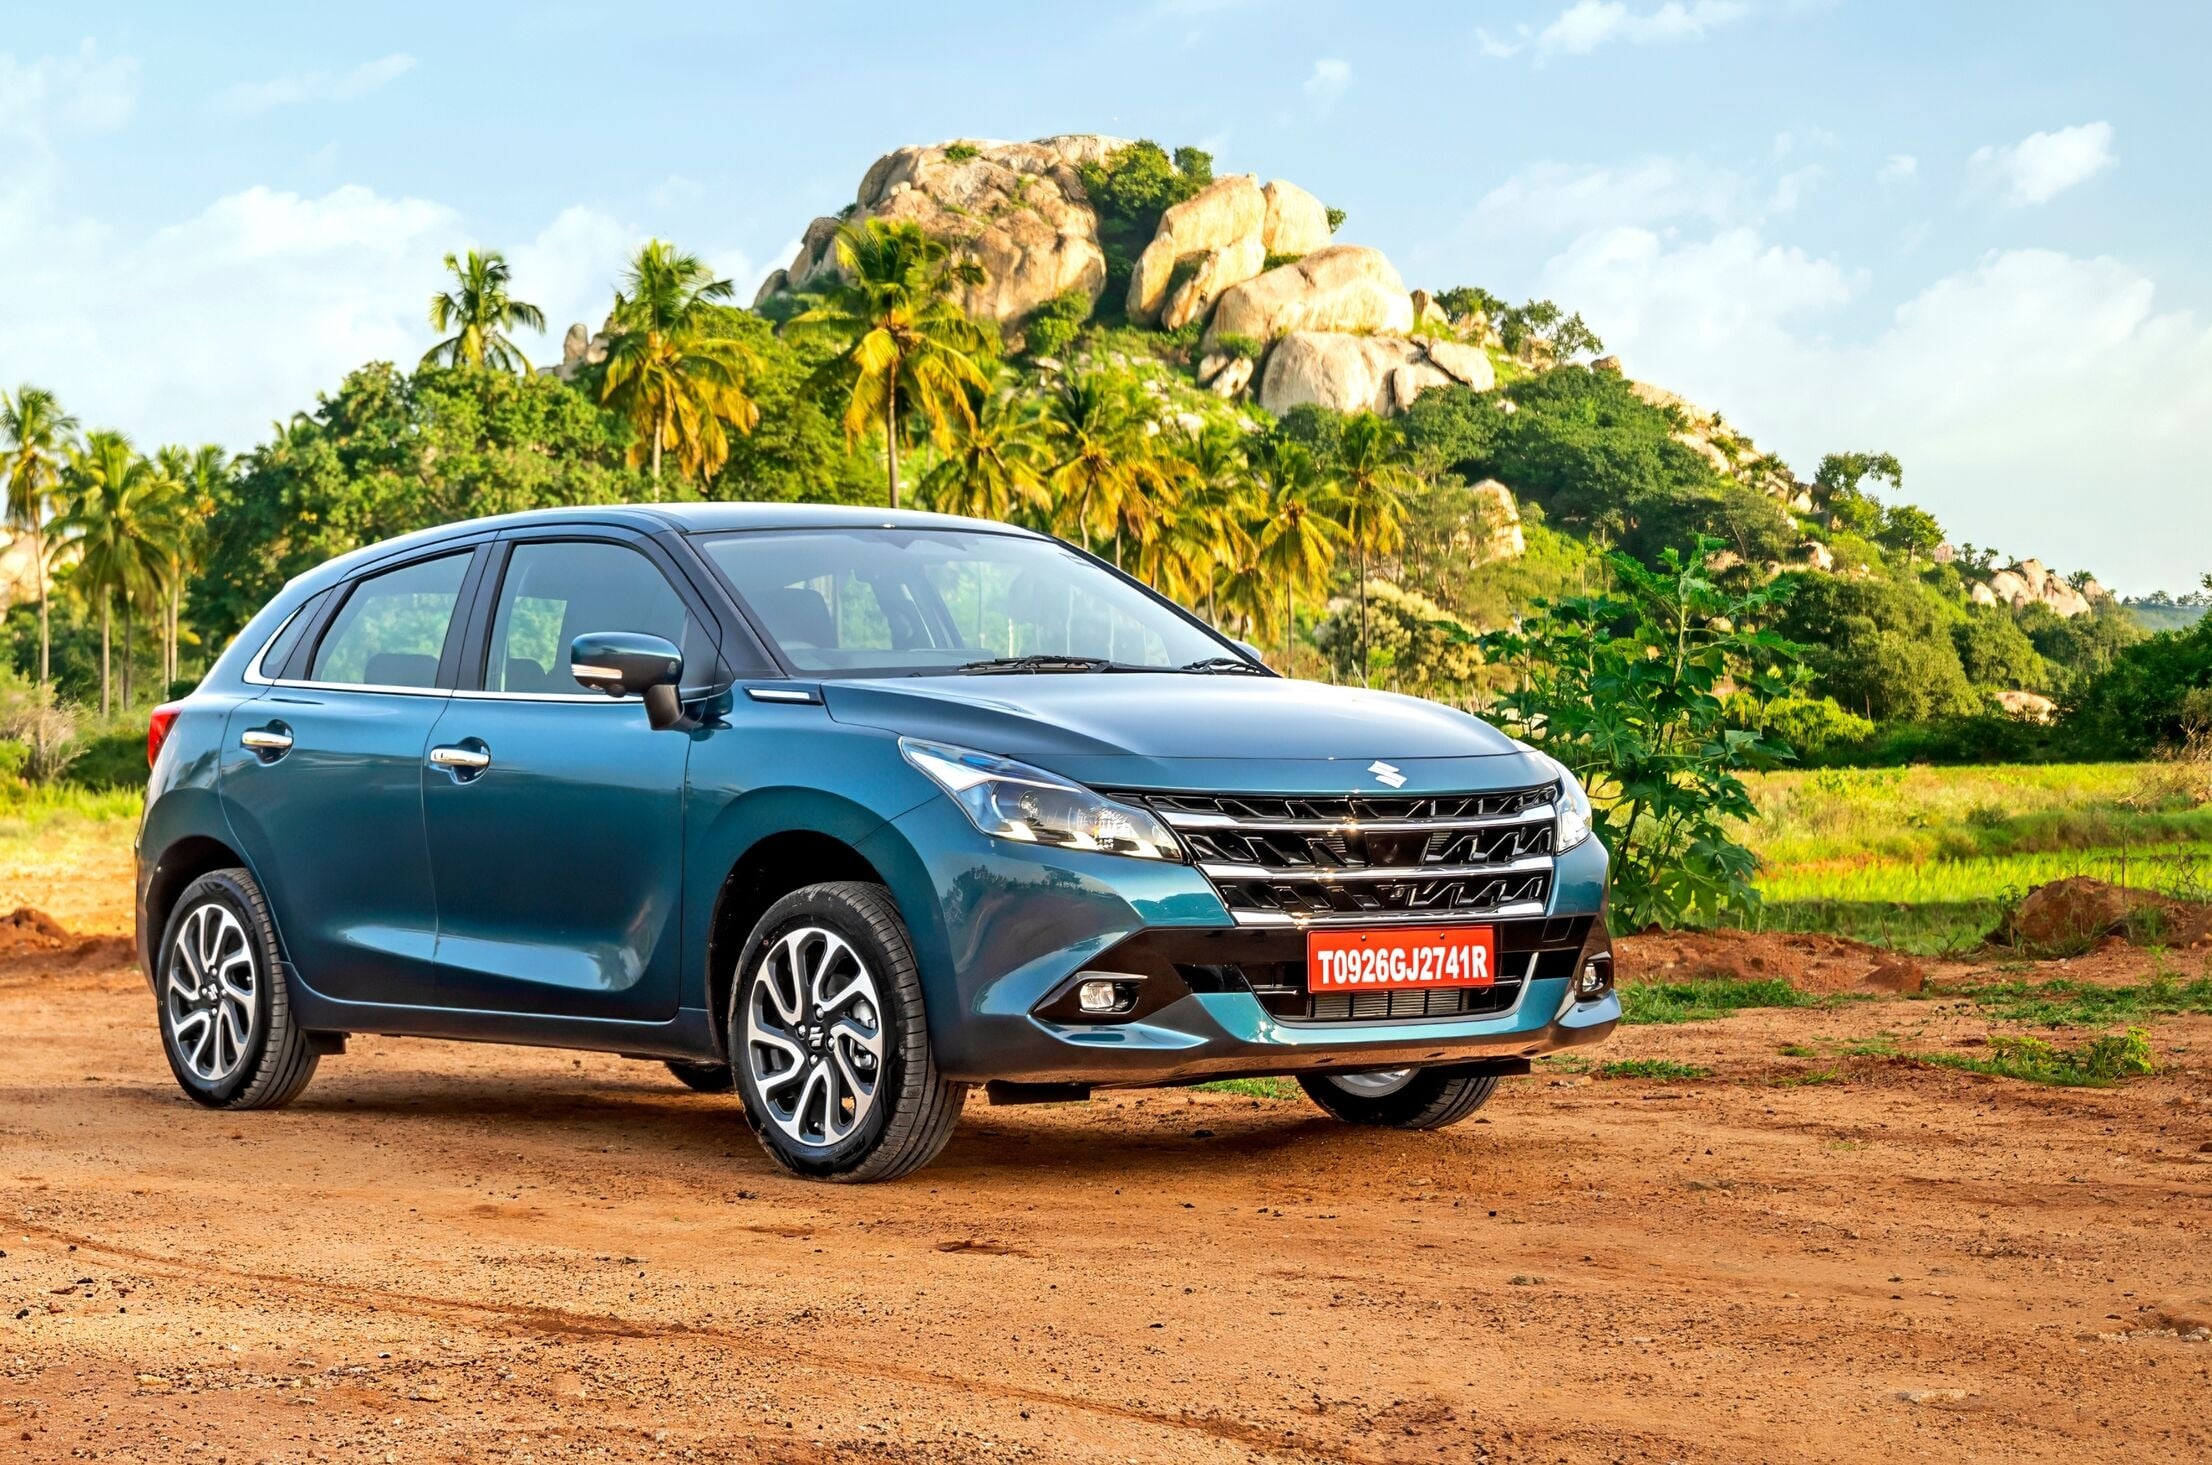
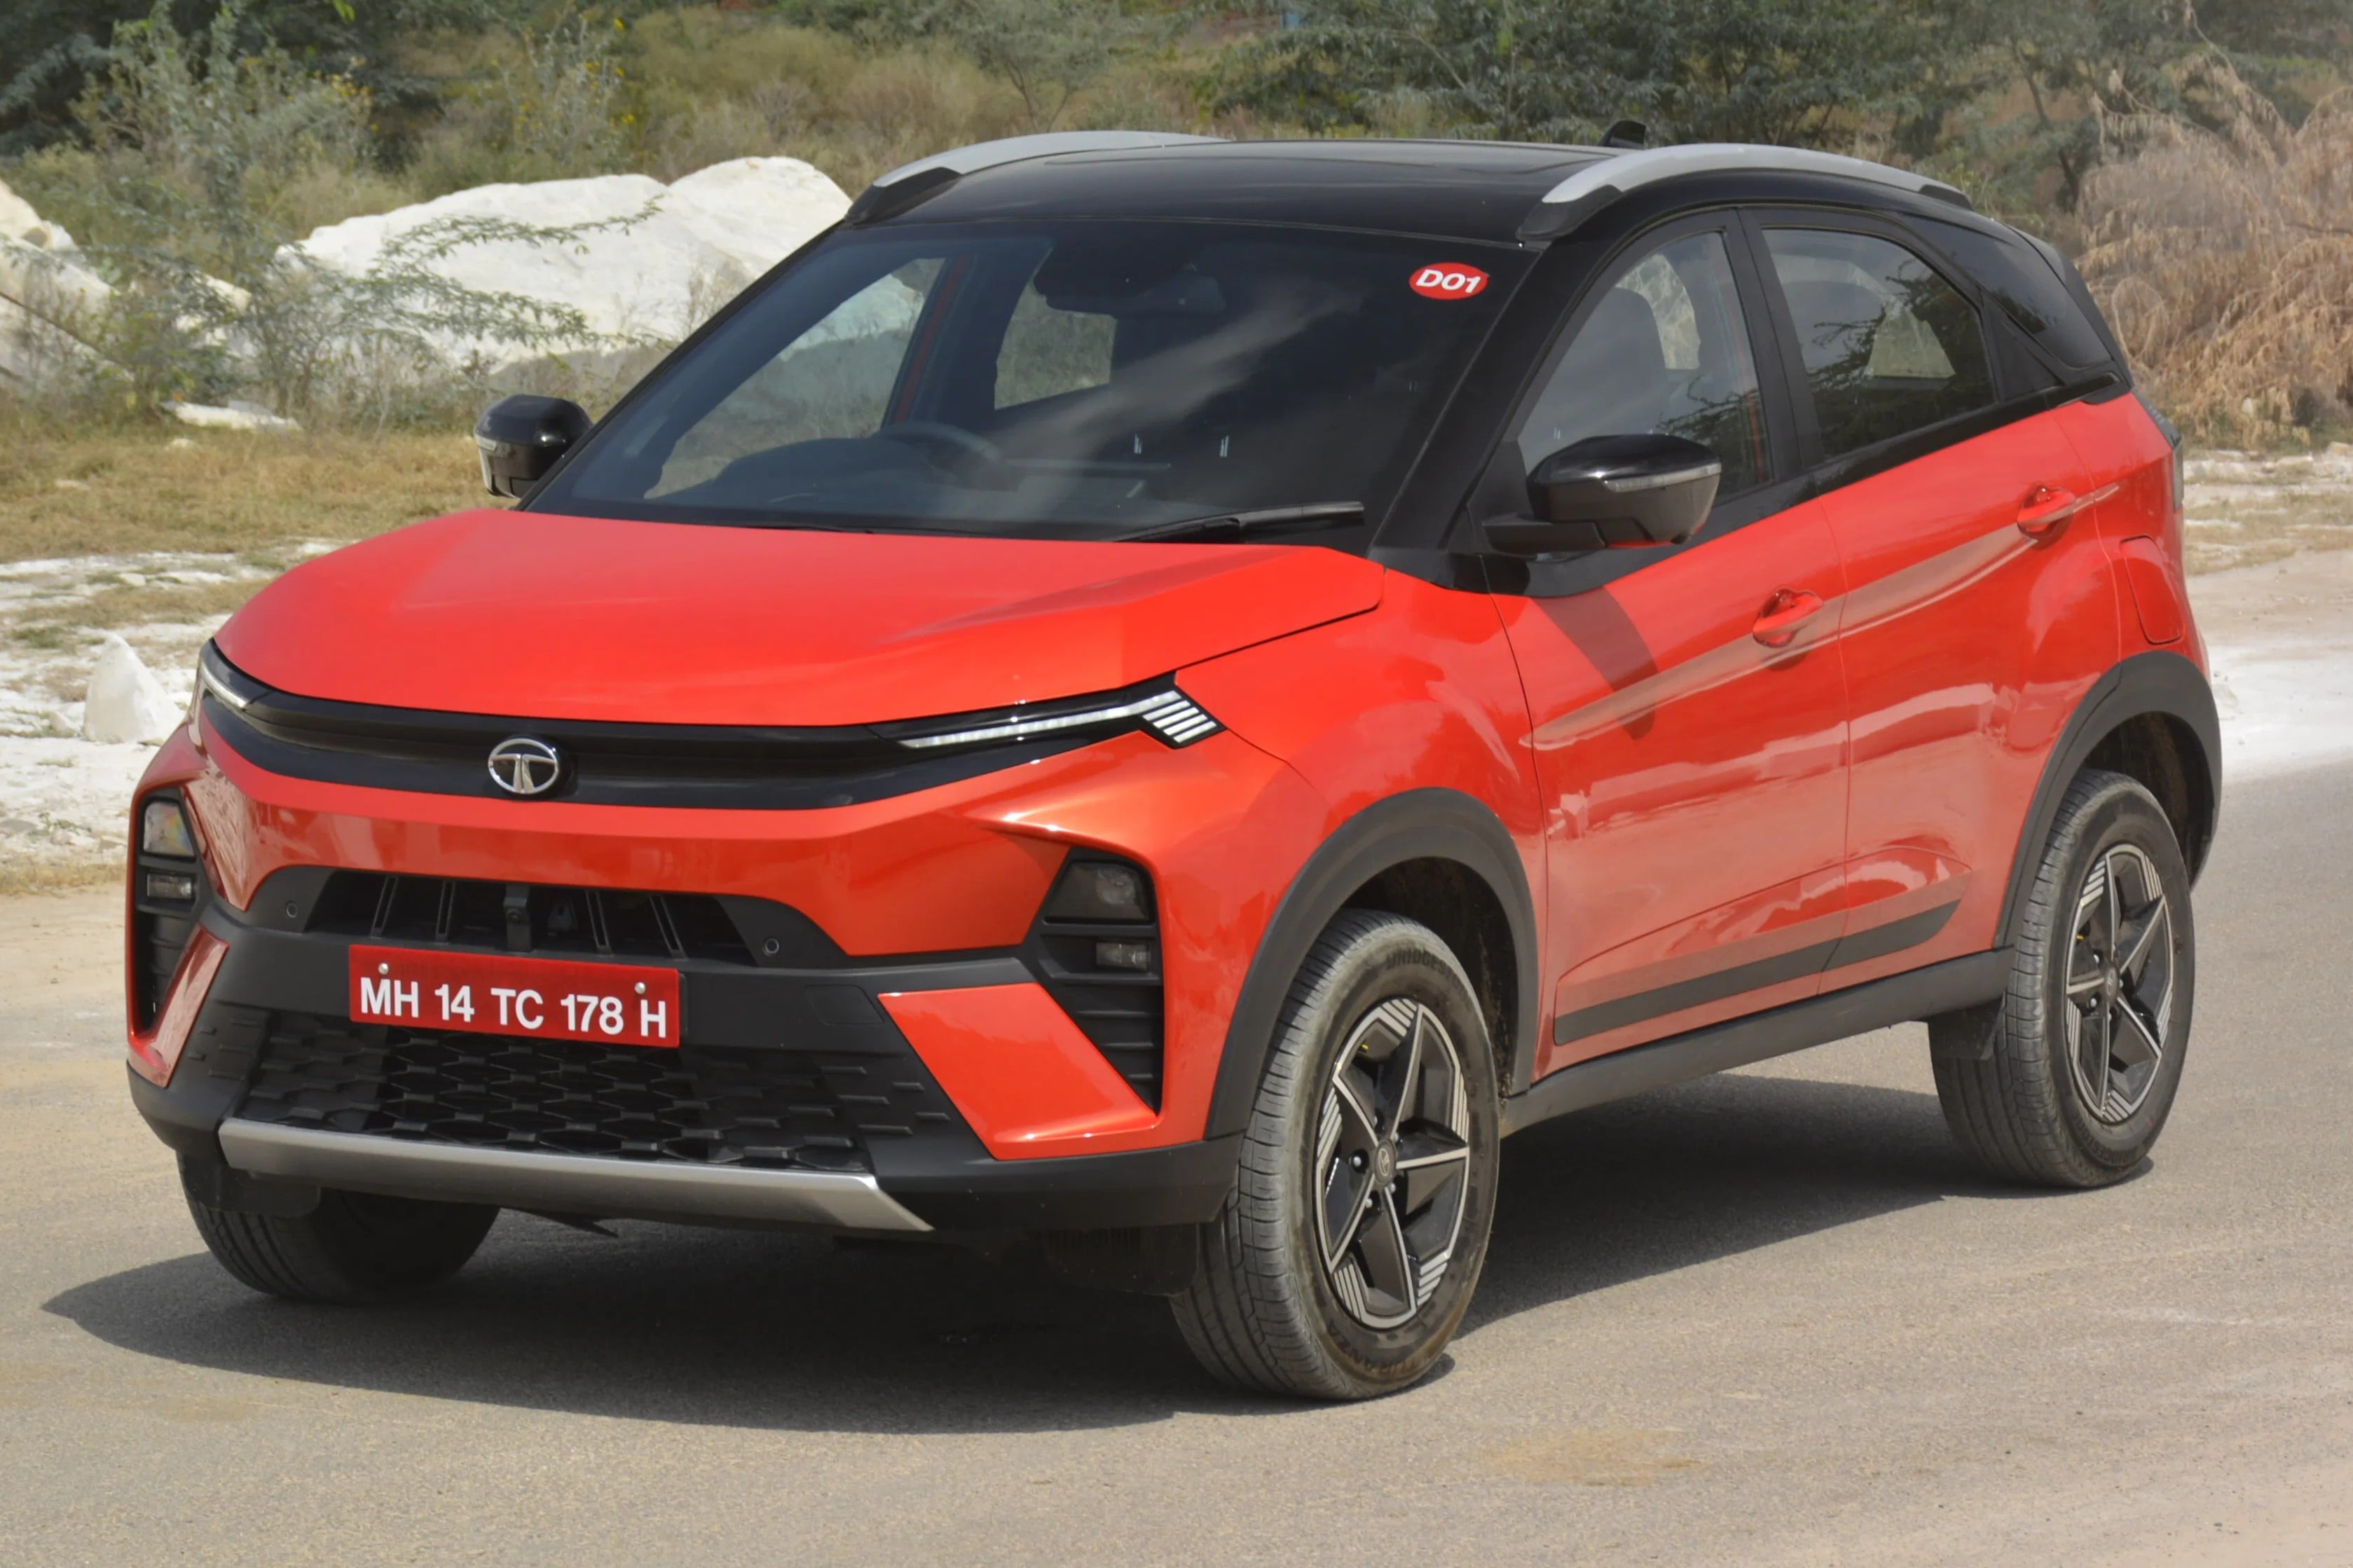
The Maruti Suzuki Baleno topped the September 2026 sales rankings with 25,392 units, compared with 13,173 units in September 2025. Its dispatches increased 93 percent year on year, the highest growth rate among the 10 models. The premium hatchback recently received a facelift and is sold through Maruti Suzuki’s Nexa dealership network. It rivals the Hyundai i20, Tata Altroz and Toyota Glanza. The Baleno is priced between Rs 5.99 lakh and Rs 9.99 lakh.
2. Tata Nexon
The Tata Nexon, including the Nexon EV, recorded 20,456 units in September 2026, down 9 percent from 22,573 units in the same month last year. It finished second, just 123 units ahead of the Punch. The Nexon is available with petrol, diesel, CNG and electric powertrains. It rivals the Maruti Suzuki Brezza, Hyundai Venue, Kia Sonet and Mahindra XUV 3XO and is priced from Rs 7.40 lakh to Rs 14.52 lakh for the ICE powered Nexon, while the Nexon EV starts at Rs 12.49 lakh and goes up to 17.89 lakh.
3. Tata Punch
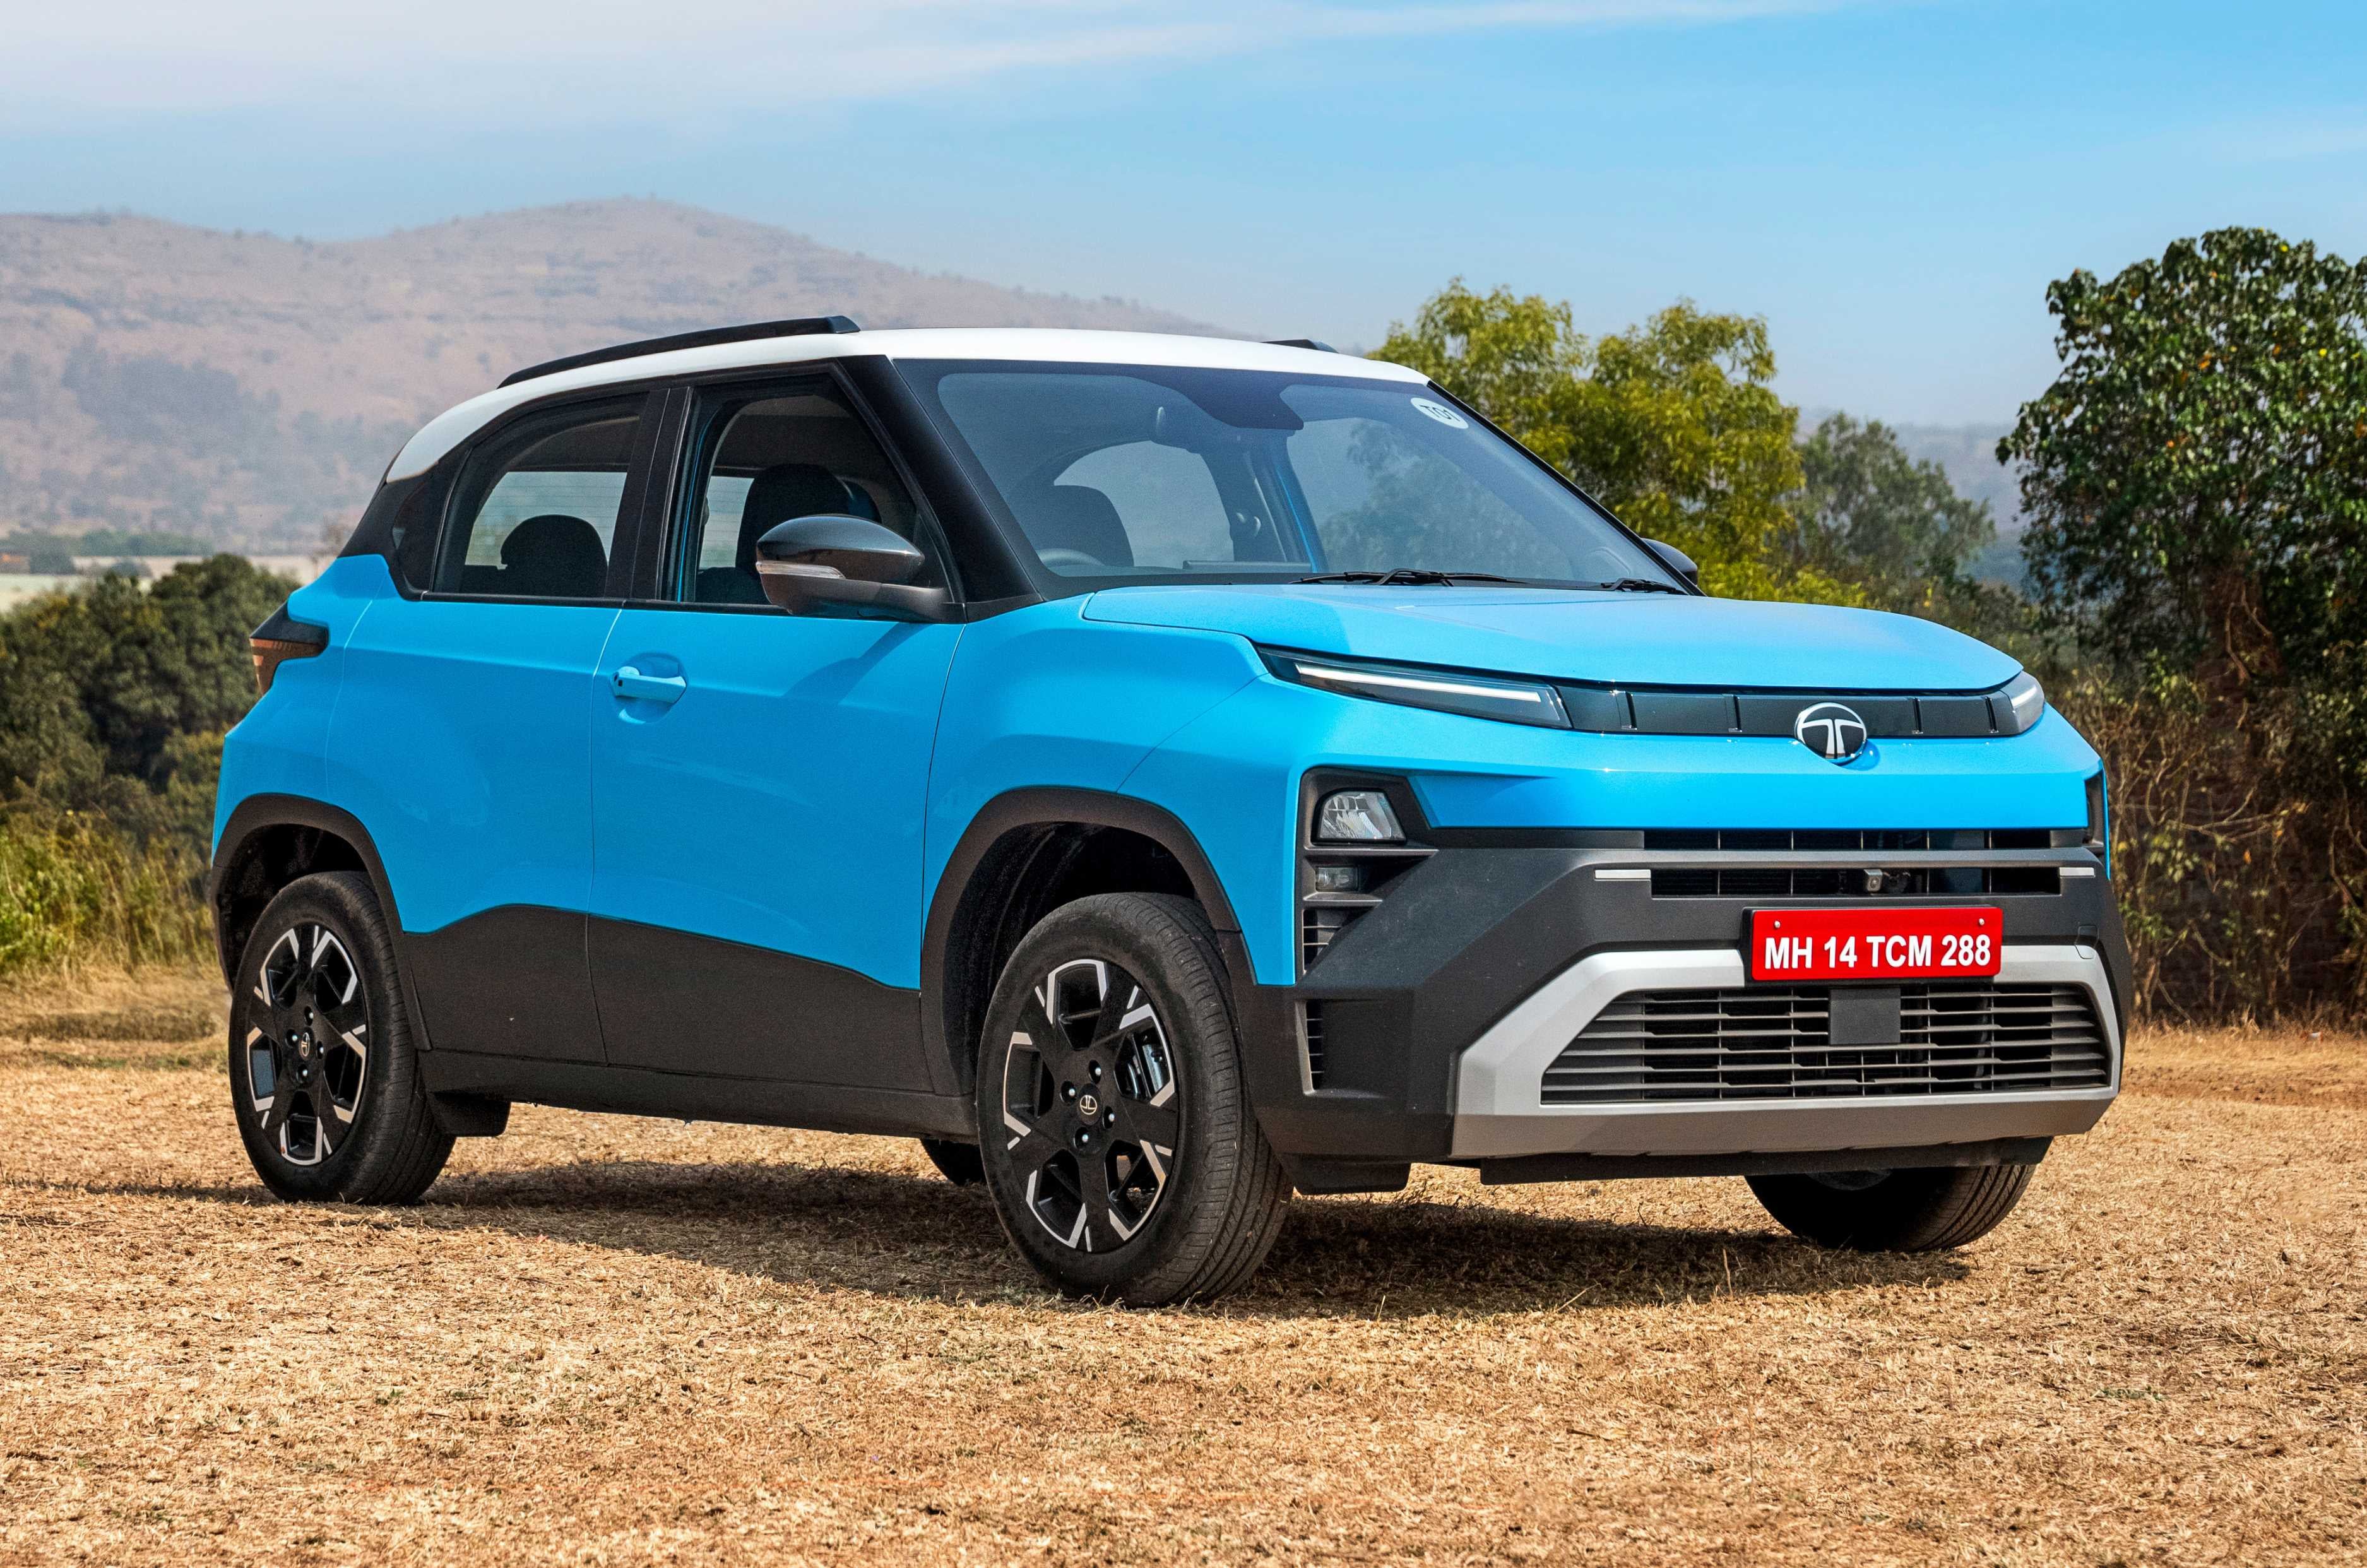
The Tata Punch, including the Punch EV, recorded 20,333 units in September 2026, up 28 percent from 15,891 units a year earlier. It ranked third in the overall list, with the Nexon finishing narrowly ahead. Tata’s smallest SUV is offered with multiple powertrain options, while its compact dimensions and ride-and-handling balance remain key strengths. The Punch rivals the Hyundai Exter and Citroen C3 and is priced from Rs 5.75 lakh to Rs 10.77 lakh. The Punch EV meanwhile is priced from Rs 9.79 lakh to Rs 12.99 lakh.
4. Maruti Suzuki Fronx
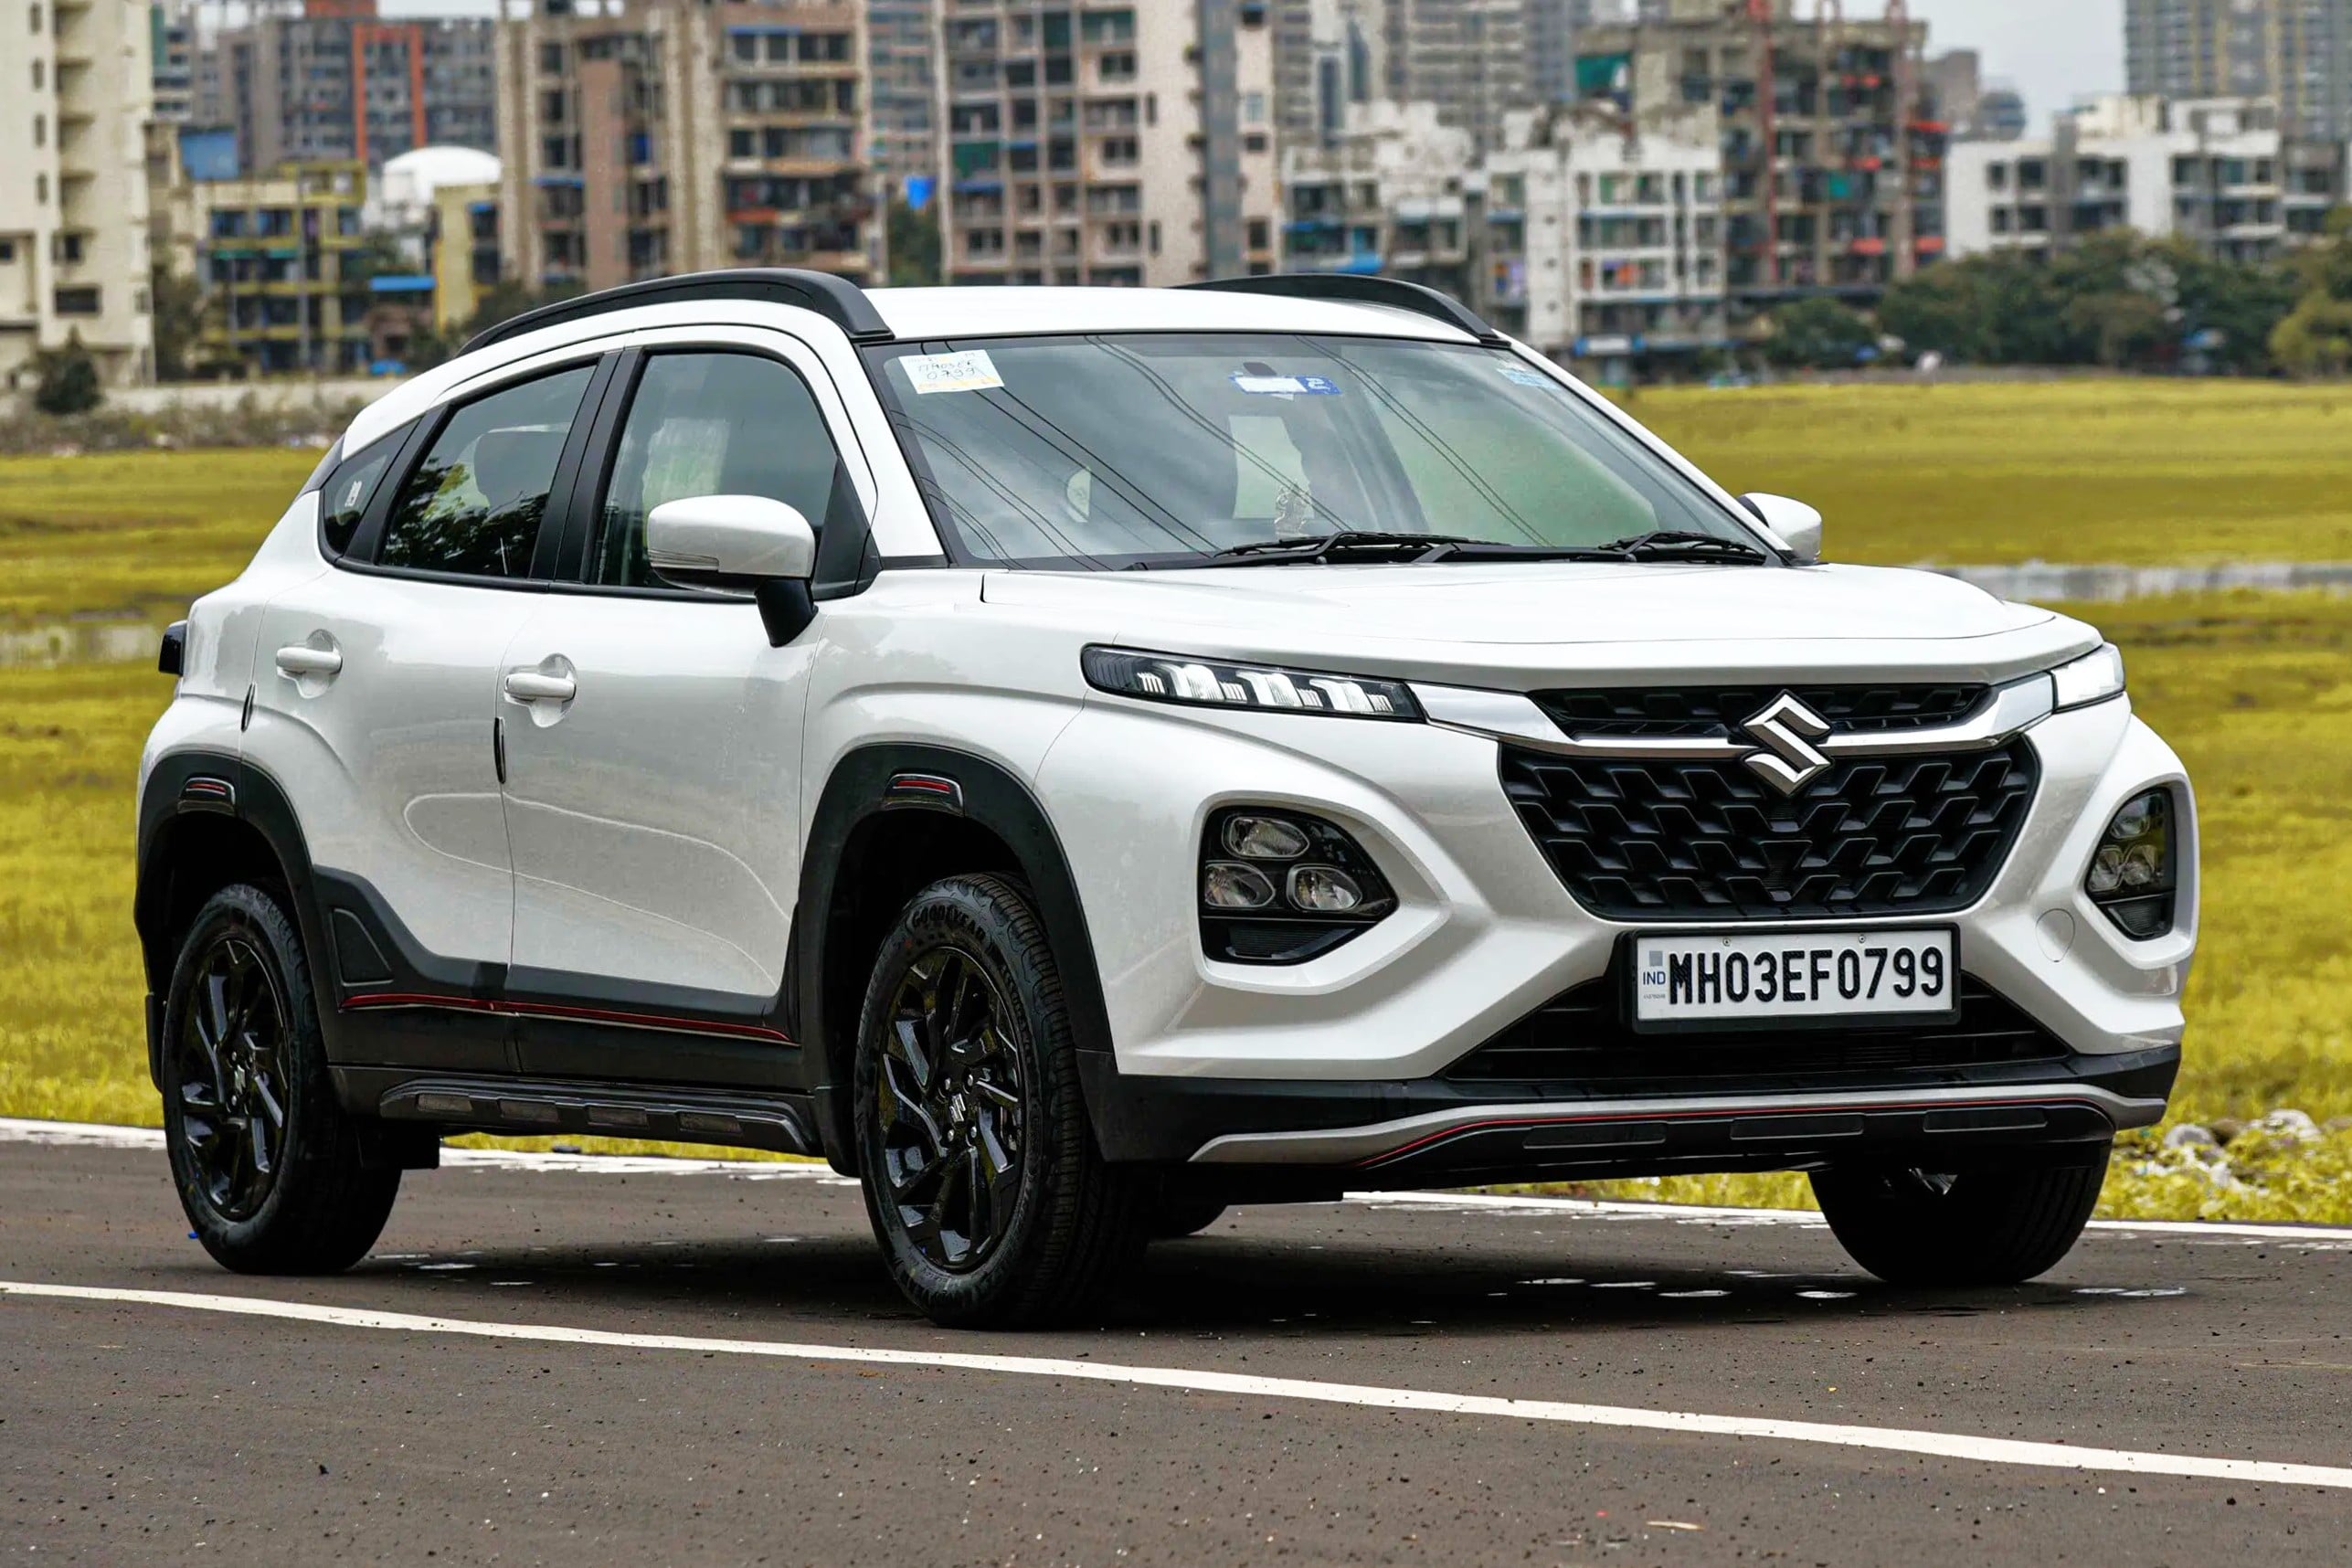
The Maruti Suzuki Fronx ranked fourth in September 2026 with 19,282 units, compared with 13,767 units in September 2025. Its dispatches increased 40 percent year on year. The Fronx’s crossover styling, comfortable cabin and fuel-efficient powertrains continue to support demand, although it lacks some popular features. It rivals the Nissan Magnite and Renault Kiger and is priced between Rs 6.85 lakh and Rs 11.84 lakh.
5. Maruti Suzuki Wagon R
The Maruti Suzuki Wagon R recorded 18,835 units in September 2026, up 22 percent from 15,388 units in the same month last year. It finished fifth in the rankings. Its spacious cabin, ease of driving and low running costs remain key strengths, although its light build and limited highway ability are drawbacks. The Wagon R rivals the Tata Tiago and Citroen C3 and is priced between Rs 4.99 lakh and Rs 7.24 lakh.
6. Maruti Suzuki Dzire
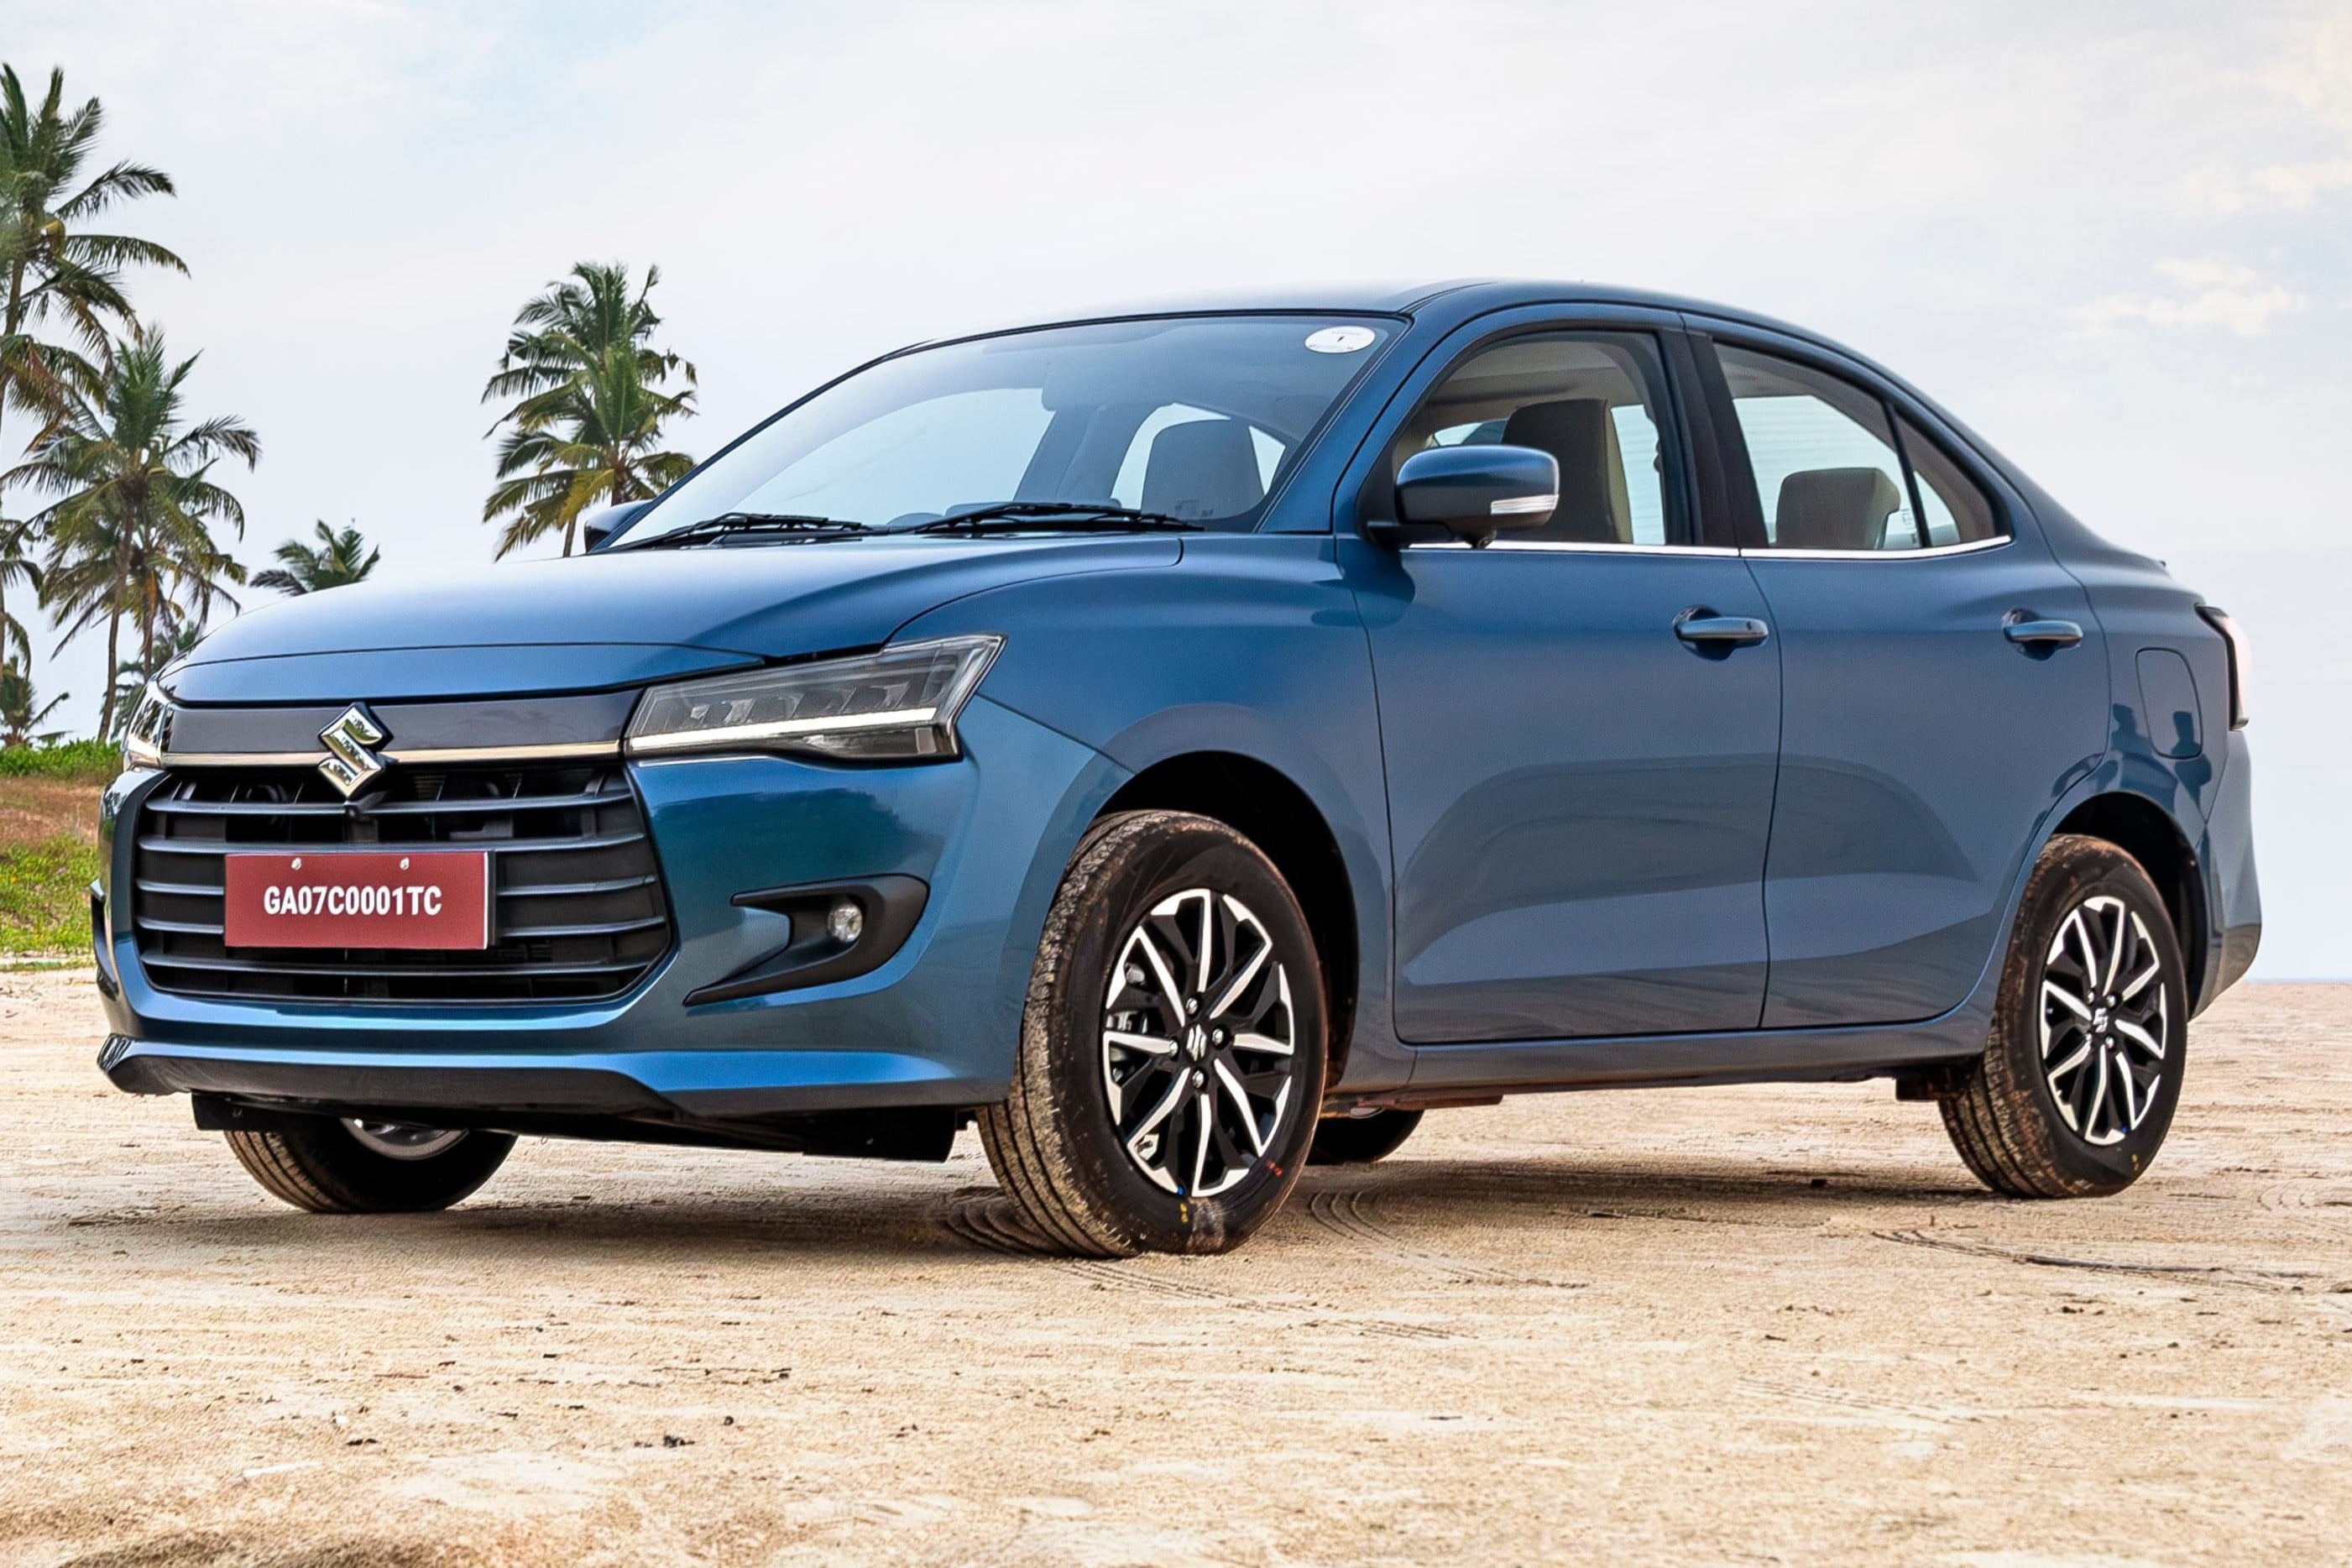
The Maruti Suzuki Dzire recorded 17,754 units in September 2026, down 11 percent from 20,038 units in September 2025. It ranked sixth and was the only sedan in the top 10. Strong fleet demand, fuel efficiency and a well-balanced ride and handling setup continue to support the compact sedan’s volumes. The Dzire rivals the Hyundai Aura, Honda Amaze and Tata Tigor and is priced between Rs 6.31 lakh and Rs 9.41 lakh.
7. Hyundai Creta
The Hyundai Creta, including the Creta Electric, recorded 17,657 units in September 2026, a 6 percent decline from 18,861 units in the year-ago month. It was the only Hyundai model in the top 10, finishing seventh. A roomy cabin, multiple powertrain options and a long feature list continue to attract buyers, although the top variants are expensive and some interior plastics could be better. The Creta rivals the Kia Seltos, Maruti Suzuki Grand Vitara, Toyota Urban Cruiser Hyryder, Honda Elevate and Tata Sierra. It is priced between Rs 10.91 lakh and Rs 20.14 lakh.
8. Maruti Suzuki Swift
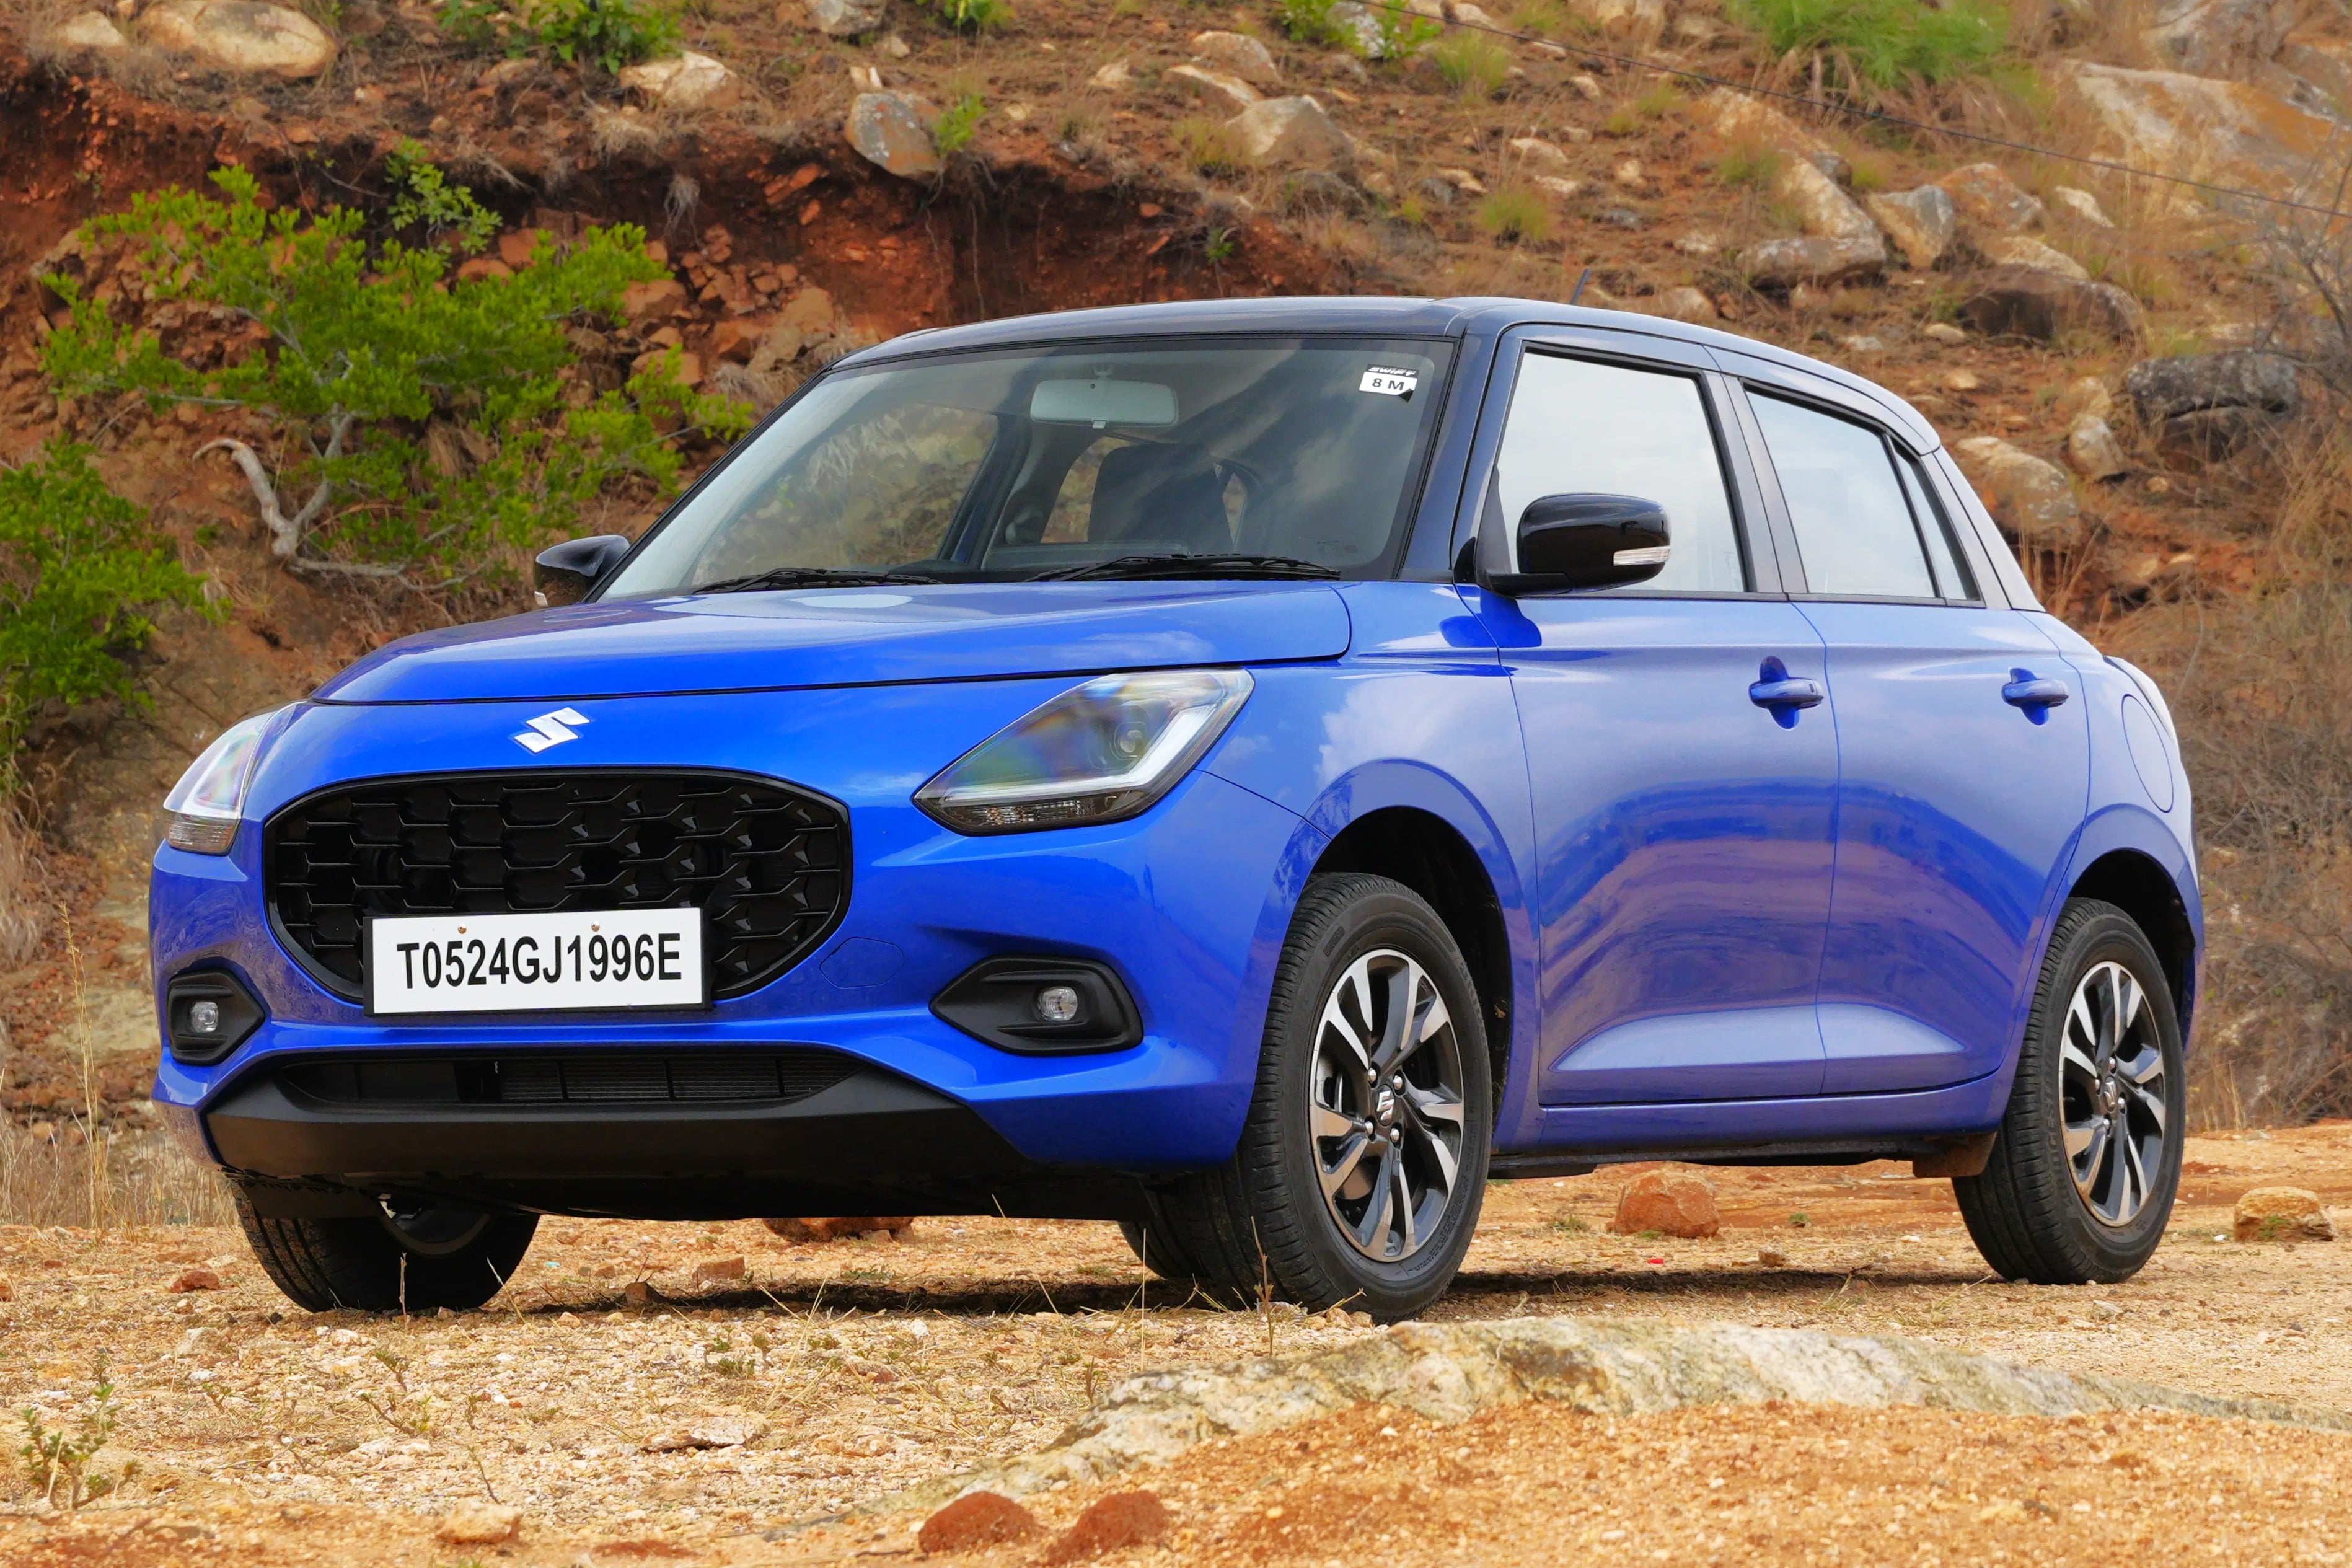
The Maruti Suzuki Swift recorded 17,399 units in September 2026, up 12 percent from 15,547 units a year earlier. It finished eighth and was one of three Maruti Suzuki hatchbacks in the top 10. Its high fuel efficiency, light controls and easy-to-drive nature continue to support demand, although the top variants are priced close to the more premium Baleno. The Swift rivals the Hyundai Grand i10 Nios and Tata Tiago and is priced between Rs 5.84 lakh and Rs 8.74 lakh.
9. Mahindra Scorpio
The Mahindra Scorpio, combining the Scorpio N and Scorpio Classic, recorded 17,313 units in September 2026. This was down 6 percent from 18,372 units in September 2025, placing it ninth. The Scorpio nameplate remains popular for its strong engines, rugged character and off-road ability. However, the third-row seating is cramped and the luggage area is not particularly practical. The Scorpio N rivals the Tata Safari, Hyundai Alcazar and Mahindra XUV 7XO and is priced from Rs 13.69 lakh to Rs 25.49 lakh.
10. Maruti Suzuki Ertiga
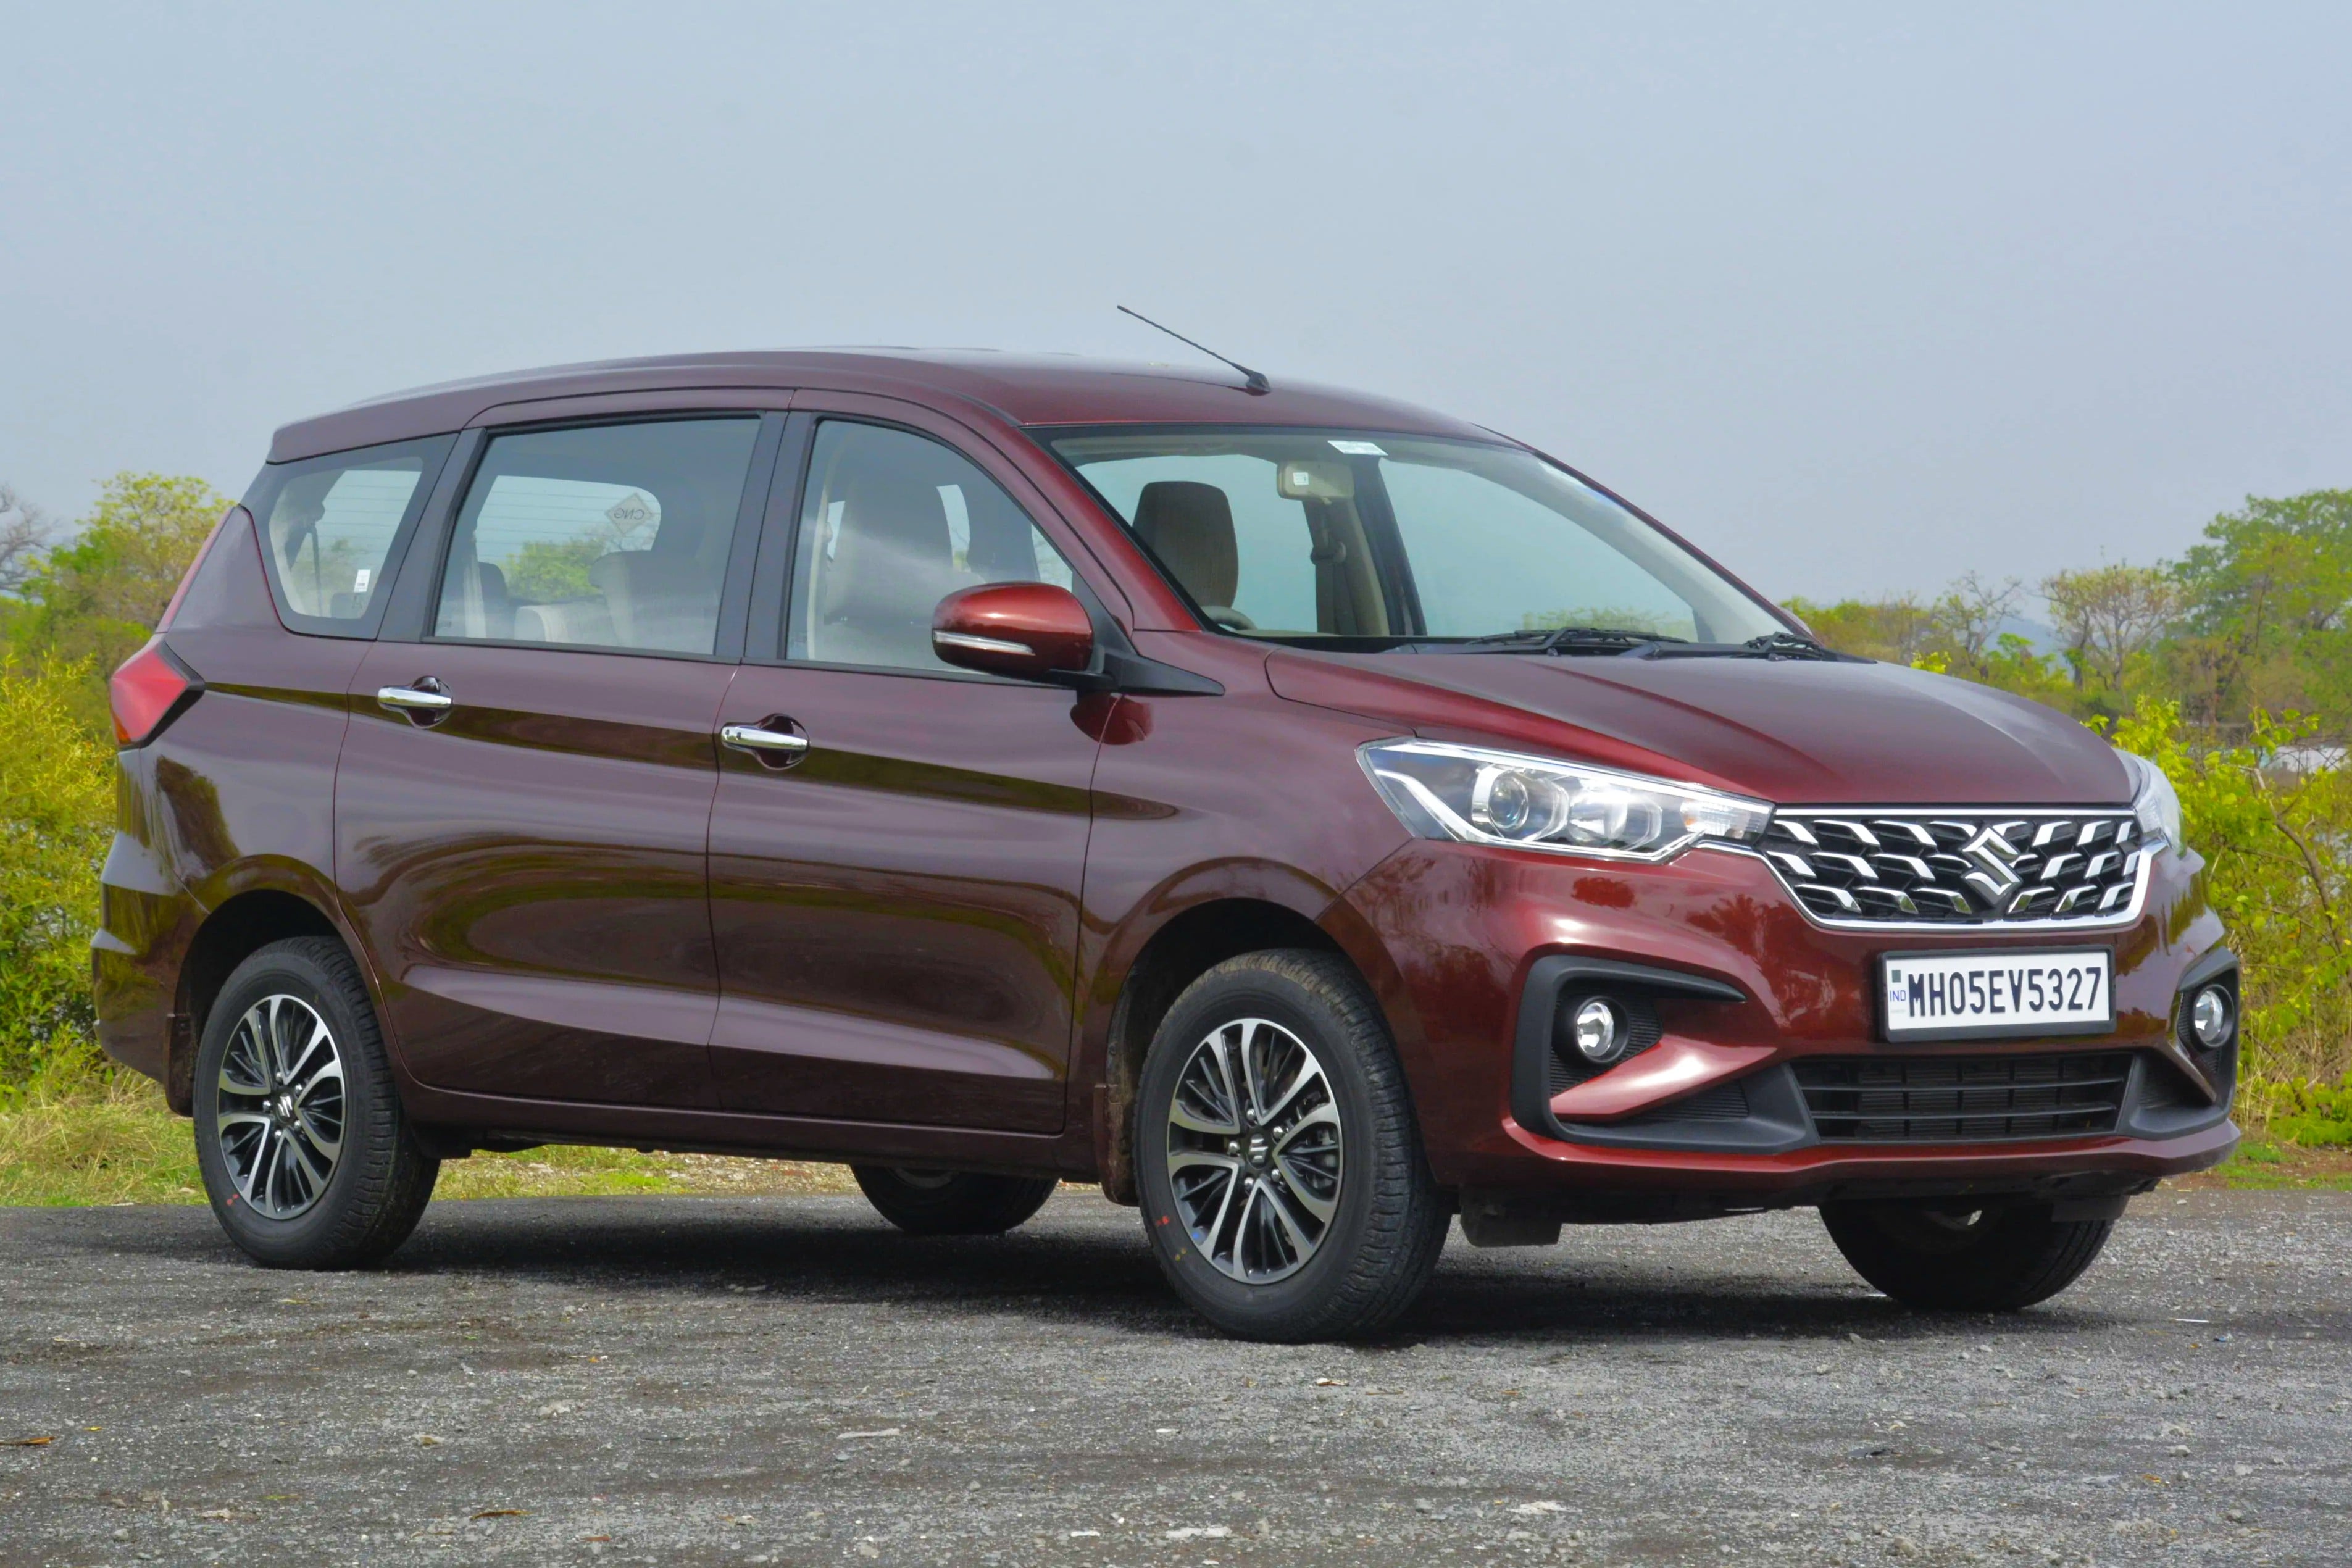
The Maruti Suzuki Ertiga completed the top 10 with 16,911 units in September 2026, up 40 percent from 12,115 units in the same month last year. It was the sixth Maruti Suzuki model in the rankings. The Ertiga continues to hold the title of India’s highest-selling MPV. Its practical cabin, strong fuel efficiency and value-for-money positioning attract both private and fleet buyers, although it misses out on some features offered by rivals. It is priced from Rs 8.90 lakh to Rs 13.04 lakh and rivals the Kia Carens and Toyota Rumion.
Best OnlyFans Ranking: A Practical Guide to Choosing the Top Creators
1. Understanding the OnlyFans Landscape
OnlyFans has grown from a niche subscription service into a global marketplace where creators of all types can monetize exclusive content. The platform is open to artists, fitness coaches, chefs, and many other professionals, each leveraging a personalized fan base for recurring income. Because the ecosystem is so diverse, newcomers often wonder how to identify the most successful creators and whether those rankings matter for their own strategy.
In practice, the best onlyfans ranking reflects a blend of audience size, earnings consistency, engagement rates, and niche relevance. By studying these factors, you can gauge which creators set realistic standards and which tactics are worth emulating. This understanding forms the foundation for any decision‑making process on the platform.
2. How Rankings Are Determined
Rankings typically aggregate public metrics such as subscriber count, monthly earnings, post frequency, and interaction levels (likes, comments, direct messages). Some third‑party tools also factor in growth trends and audience demographics to provide a more nuanced picture. While raw numbers are important, qualitative aspects like brand consistency and content quality heavily influence long‑term ranking stability.
Most reputable rankings use algorithms that assign weighted scores to each metric. For example, subscriber count might carry a 30 % weight, while engagement averages account for 25 %. Understanding this methodology helps you interpret a ranking position beyond just a headline number.
3. Top Criteria for Evaluating OnlyFans Creators
When you compare creators, focus on the following criteria:
Audience size and growth rate: A large, steadily expanding subscriber base indicates market demand.
Engagement quality: High comment and message volumes show a loyal, interactive community.
Content diversity: Regularly varied media (photos, videos, live streams) keeps fans interested.
Monetization tactics: Use of paid messages, tip menus, and subscription tiers indicates revenue optimization.
Brand consistency: Cohesive visual style and messaging help maintain fan trust.
By scoring each creator against these benchmarks, you can build a personalized ranking that aligns with your business needs.
4. The Current Best OnlyFans Ranking – Who Leads the Pack
Based on publicly available data from the last quarter, the following creators consistently appear at the top of the best onlyfans ranking. They excel across the criteria discussed above and set industry standards for content strategy, pricing, and fan interaction.
Creator
Monthly Subscribers
Average Earnings (USD)
Primary Niche
Key Strength
Alice Blaze
125,000
$780,000
Fitness & Lifestyle
High‑volume live workouts
Nova Noir
98,000
$620,000
Adult Entertainment
Personalized video requests
Chef Marco
47,000
$210,000
Culinary Arts
Exclusive recipe bundles
These creators illustrate how different niches can dominate the ranking when they master the fundamental metrics of subscriber growth and fan engagement.
5. Features and Benefits of High‑Performing OnlyFans Accounts
Top‑ranked creators typically leverage a robust set of platform features. Automated subscription reminders, drip‑feed content schedules, and integrated payment processing reduce administrative overhead while maximizing revenue.
Benefits include predictable cash flow, deeper fan relationships, and the ability to scale content production without sacrificing quality. By using the dashboard analytics, successful creators can identify peak posting times and adjust pricing tiers to capture maximum willingness to pay.
6. Pricing, Payouts, and Monetization Strategies
Pricing is a delicate balance between perceived value and market competition. Most top creators set a base subscription between $15‑$30, then offer premium bundles, pay‑per‑view content, and tip incentives. Seasonal promotions—such as limited‑time discounts or exclusive holiday bundles—can boost subscriber acquisition without long‑term price erosion.
Payouts on OnlyFans are processed weekly, with a standard 20 % platform fee. Creators should plan for tax obligations and reserve a portion of earnings for reinvestment in equipment, marketing, or content upgrades.
7. Setting Up for Success – Step‑by‑Step Guide
Getting started on OnlyFans doesn’t require a degree in digital marketing, but a systematic approach helps you replicate the practices of the best onlyfans ranking leaders.
Create a professional profile: Use high‑resolution photos, a concise bio, and clear content categories.
Define pricing tiers: Start with a modest base price, then add premium options as your library grows.
Develop a content calendar: Plan at least three posts per week, mixing photos, videos, and live streams.
Engage daily: Respond to messages, run polls, and thank top fans to boost loyalty.
Analyze performance: Use the built‑in dashboard to track subscriber growth and adjust strategies.
Following these steps positions you to climb the ranking ladder while maintaining a sustainable workflow.
8. Common Pitfalls and How to Avoid Them
Even the most dedicated creators encounter obstacles. Below are frequent mistakes and practical solutions:
Inconsistent posting: Set automated reminders or batch‑create content to maintain a steady flow.
Over‑pricing early on: Test lower price points first; you can increase rates once you have proven value.
Neglecting fan feedback: Conduct regular surveys and adjust content based on direct requests.
Ignoring platform policies: Review OnlyFans terms to avoid content removals or account suspensions.
By proactively addressing these issues, you minimize churn and protect your position in the best onlyfans ranking.
9. Frequently Asked Questions
Is the best onlyfans ranking reliable for newcomers?
While rankings provide a useful snapshot of top performers, they should be combined with your own niche analysis. Use them as benchmarks, not absolute rules.
How long does it take to appear in the ranking?
Most creators see measurable movement within three to six months of consistent effort, provided they follow best practices for content and engagement.
Can I improve my ranking without increasing prices?
Yes. Enhancing engagement, offering exclusive experiences, and optimizing posting times can boost your score even with stable pricing.
Best OnlyFans Sites: A Practical Guide for Creators and Fans
Understanding OnlyFans and What Makes a Site Among the Best OnlyFans Sites
OnlyFans started as a subscription‑based platform that lets creators share exclusive content with paying fans. Over time, dozens of similar services have emerged, each tweaking the original formula with different feature sets, revenue models, and community tools. When you hear the phrase “best only fans sites,” it usually refers to platforms that balance creator freedom, fan engagement, and reliable earnings.
To differentiate the top choices, focus on three core pillars: the robustness of the platform’s features, the fairness of its pricing and revenue share, and the strength of its security and support infrastructure. By anchoring your decision on these pillars, you can avoid gimmicks and choose a service that truly meets your business needs.
Key Features and Benefits to Look For
A solid platform will offer a set of essential features that empower both creators and fans. Look for a customizable dashboard that lets creators schedule posts, manage subscriptions, and track earnings in one place. Automation tools such as scheduled posting, auto‑reply messages, and workflow integrations can save time and keep the audience engaged.
Benefits of these features include higher fan retention, smoother monetization, and the ability to scale your content operation without constantly juggling manual tasks. When a platform bundles these capabilities into an intuitive interface, it becomes a strong candidate among the best only fans sites.
Feature Checklist
Content scheduling and calendar tools
Advanced analytics dashboard
Built‑in messaging and automation
Multiple payment gateways
Customizable subscription tiers
Pricing Models and How They Influence Your Decision
Pricing structures vary widely across platforms. Some charge a flat monthly fee, while others take a percentage of creator earnings. Understanding these models helps you forecast net revenue and choose a site that aligns with your financial goals.
When evaluating the best only fans sites, compare the total cost of ownership—including transaction fees, payout schedules, and any hidden charges. A platform with a higher revenue share but lower transaction fees might ultimately be more profitable than one with a low percentage but hefty processing costs.
Typical Pricing Comparison
Platform
Monthly Subscription Range
Revenue Share
Unique Feature
Platform A
$4.99 – $49.99
80%
Integrated live‑stream tipping
Platform B
$5 – $50
85%
AI‑powered content suggestions
Platform C
$3 – $45
78%
Multi‑currency payouts
Security, Reliability, and Support – Non‑Negotiable Factors
Any platform handling paid subscriptions must prioritize security and reliability. Look for encryption standards, two‑factor authentication, and regular third‑party security audits. A reliable uptime record ensures that fans can access content without interruption, protecting both creator reputation and revenue.
Equally important is responsive support. Whether you need help with onboarding, troubleshooting payouts, or addressing policy questions, a dedicated support team that offers live chat or ticket‑based assistance can make a big difference. Choose a site whose support hours align with your operating timezone.
Support Features to Expect
24/7 live chat or email ticketing
Comprehensive knowledge base
Account manager for high‑volume creators
Clear escalation path for security incidents
Setup and Integration: Getting Started Quickly
Fast onboarding reduces the time between signing up and earning your first subscription. The best only fans sites typically offer step‑by‑step guides, video tutorials, and pre‑built integrations with popular marketing tools such as email newsletters and social media schedulers.
Here’s a simple three‑step setup process you can expect:
Create an account and verify your identity.
Customize your profile, add payment details, and set subscription tiers.
Connect your preferred social channels and schedule your first batch of content.
Following these steps ensures a smooth launch and lets you focus on creating rather than troubleshooting.
Use Cases: Who Is Each Platform Best For?
Different creators have distinct needs. Some prioritize high revenue share, while others need advanced analytics or niche community features. Below are common use cases and the platform type that usually fits best.
Typical Creator Profiles
Fitness influencers: Need integrated live‑stream workouts and tipping.
Artists and photographers: Require high‑resolution media support and customizable galleries.
Adult content creators: Look for strong privacy controls and discreet billing.
Educators and coaches: Benefit from subscription bundles and private messaging.
Small‑scale hobbyists: Prefer low monthly fees and simple dashboards.
Matching your primary goals with the platform’s strengths helps you choose the most suitable site among the best only fans sites.
Final Checklist Before You Sign Up
Before committing to any platform, run through this quick checklist to ensure you’ve covered the essential criteria:
Feature set matches your content workflow.
Revenue share and pricing are transparent.
Security protocols meet industry standards.
Support channels are responsive and available in your timezone.
Onboarding process aligns with your launch timeline.
Keeping this list handy will help you avoid costly surprises and set a solid foundation for sustainable growth. For more insights and real‑world examples, visit the best onlyfans blog.