Asian Markets: सोमवार को एशिया बाजारों में दबाव देखने को मिल रहा है। कोस्पी 4 फीसदी तो निक्केई 3 फीसदी नीचे है। निक्केई करीब 1.42 फीसदी की गिरावट के साथ 63,545.00 के आसपास दिख रहा है। वहीं, स्ट्रेट टाइम्स में 0.03फीसदी की कमजोरी दिखा रहा है। ताइवान का बाजार 1.02 फीसदी चढ़कर 43,558.34 के स्तर पर कारोबार कर रहा है। जबकि हैंगसेंग 0.09 फीसदी की बढ़त के साथ 25,909.00 के स्तर पर नजर आ रहा है। वहीं, कोस्पी 3.25 फीसदी टूटा है। वहीं शंघाई कम्पोजिट 0.61 फीसदी की बढ़त के साथ 3,807.37 के स्तर पर दिख रहा है।
वॉल स्ट्रीट
रविवार शाम को अमेरिकी स्टॉक फ्यूचर्स में बढ़त देखी गई क्योंकि निवेशक जुलाई की रोज़गार रिपोर्ट और अगस्त के पहले हफ़्ते में आने वाले कई कंपनियों के नतीजों (अर्निंग्स कैलेंडर) पर नज़र बनाए हुए थे। डॉव जोन्स इंडस्ट्रियल एवरेज फ्यूचर्स में लगभग 200 अंक या 0.4% की बढ़त हुई, जबकि S&P 500 फ्यूचर्स 0.5% ऊपर चढ़े। नैस्डैक-100 फ्यूचर्स ने बेहतर प्रदर्शन किया और 0.8% की बढ़त हासिल की।
वॉल स्ट्रीट ने शुक्रवार का सत्र सकारात्मक रुख के साथ समाप्त किया; डॉव जोन्स 276.97 अंक या 0.53% बढ़कर 52,485.03 पर बंद हुआ। S&P 500 में 0.7% की बढ़त के साथ यह 7,489.72 पर पहुंचा, जबकि नैस्डैक कम्पोजिट 1% चढ़कर 25,373.85 पर बंद हुआ।
शुक्रवार को प्रमुख अमेरिकी इंडेक्स के रिकॉर्ड स्तर के करीब बंद होने के बाद, अब निवेशक यह देख रहे हैं कि क्या हालिया तेज़ी को बढ़ावा देने वाले कारक बाज़ार में आगे भी बढ़त बनाए रखने में मदद करेंगे।
कच्चे तेल की कीमतें
अमेरिकी राष्ट्रपति डोनाल्ड ट्रंप द्वारा ईरान के खिलाफ़ नियोजित सैन्य हमले को रद्द करने और सोमवार से ईरान के साथ नई बातचीत शुरू करने की घोषणा के बाद तेल की कीमतों में गिरावट आई।
अक्टूबर डिलीवरी के लिए ब्रेंट क्रूड शुरुआती एशियाई कारोबार में 7.3% तक गिर गया, जबकि जुलाई में इसमें लगभग 25% की तेजी आई थी , जो मार्च के बाद से इसकी सबसे बड़ी मासिक बढ़त थी। इस बीच, वेस्ट टेक्सास इंटरमीडिएट (WTI) क्रूड 81 डॉलर प्रति बैरल के स्तर से नीचे आ गया।
अमेरिका-ईरान युद्ध
अमेरिकी राष्ट्रपति डोनाल्ड ट्रंप ने रविवार को एयर फ़ोर्स वन में कहा कि उन्होंने ईरान पर बड़े पैमाने पर होने वाले सैन्य हमले को रद्द कर दिया है। ऐसा उन्होंने सऊदी अरब समेत मध्य-पूर्व के प्रमुख सहयोगियों के कहने पर किया, जिन्होंने अमेरिका से कूटनीतिक समाधान खोजने का आग्रह किया था। उन्होंने कहा कि यह ऑपरेशन इस शर्त पर रद्द किया गया कि होर्मुज जलडमरूमध्य (Strait of Hormuz) को फिर से खोलने के लिए जल्द समझौता करने की कोशिशें जारी रहेंगी, साथ ही उन्होंने सभी पक्षों से बातचीत में तेज़ी लाने को भी कहा।
आज सोने की कीमत
अमेरिकी राष्ट्रपति डोनाल्ड ट्रंप के यह कहने के बाद कि सोमवार को ईरान के साथ फिर से बातचीत शुरू होगी, सोने की कीमतों में थोड़ी बढ़ोतरी हुई। इससे उम्मीद जगी कि लंबे समय से चल रहे इस टकराव में कोई समाधान निकलने से ऊर्जा-जनित महंगाई को कम करने में मदद मिल सकती है।
जुलाई में 1% की बढ़त के बाद सोने का कारोबार $4,070 प्रति औंस के आसपास हुआ; फरवरी के बाद यह सोने में पहली मासिक बढ़त थी।
हालिया बढ़ोतरी के बावजूद, पांच महीने से ज़्यादा समय पहले शुरू हुए अमेरिका-ईरान टकराव के बाद से सोने की कीमत में 20% से ज़्यादा की गिरावट आई है। ऊर्जा की ऊंची कीमतों ने महंगाई की चिंताएं बढ़ा दी हैं, जिससे यह उम्मीद बढ़ गई है कि ब्याज दरें लंबे समय तक ऊंची बनी रह सकती हैं,जो सोने जैसी बिना रिटर्न वाली संपत्तियों के लिए एक नकारात्मक बात है।
Stock Market Live Update: क्रूड में नरमी से गिफ्ट निफ्टी का जोश हाई है। गिफ्ट निफ्टी 125 अंकों की तेजी के साथ ट्रेड कर रहा है। वहीं US फ्यूचर्स भी ऊपर है। 4.74 परसेंट तक जाने के बाद US बॉन्ड यील्ड नरम पड़ी है और यह 4.7 के नीचे फिसली है। इधर शुक्रवार को अमेरिकी बाजारों में भी रौनक दिखी। हालांकि एशिया दबाव में नजर आ रहा है। कोस्पी 5 परसेंट तो जापान का बाजार निक्केई 3 परसेंट नीचे फिसला है।
रविवार को ट्रंप के यह कहने के बाद कि उन्होंने ईरान के खिलाफ़ तय हमले रद्द कर दिए हैं, तेल की कीमतों में गिरावट आई। तेहरान और मध्य पूर्व के दूसरे देशों ने उनसे हमले न करने का अनुरोध किया था ताकि दोनों पक्ष किसी समझौते पर पहुंच सकें।
ट्रंप ने कहा कि प्रस्तावित समझौते में “होरमुज़ जलडमरूमध्य (स्ट्रेट ऑफ़ होरमुज़) को तुरंत, पूरी तरह और हर तरह से खोलने” का प्रावधान होगा और इससे ईरान के परमाणु कार्यक्रम से जुड़े खतरे का भी समाधान होगा। ब्रेंट क्रूड की कीमत $3.52 गिरकर $84.41 प्रति बैरल हो गई, जबकि U.S. वेस्ट टेक्सास इंटरमीडिएट की कीमत $3.49 गिरकर $81.18 हो गई।
The TVS Ronin has posted its strongest-ever quarterly performance, with wholesales of 28,619 units in Q1 FY27 – a 97 percent year-on-year increase over the 14,530 units sold in the same period last year.
TVS Ronin posts 97 percent YoY growth with 28,619 units in Q1 FY27
Holds a 36 percent share of the 200-250cc segment
On course to cross 1 lakh annual sales for the first time in FY27
TVS Ronin sales surge
The segment itself grew 107 percent YoY – the fastest of any displacement band
The result gives the Ronin an 8 percent share of TVS’s total motorcycle dispatches for the quarter, doubling its 4 percent share from a year ago. Cumulative sales since launch have crossed the 1.75 lakh mark. The Ronin’s strong numbers are partly a reflection of what’s happening more broadly in the 200-250cc segment, which saw total sales of 78,880 units in Q1 FY27 – more than double the 38,157 units sold in the same period last year, making it the fastest-growing displacement band in the two-wheeler market. Within this segment, the Ronin holds a 36 percent share, just behind the Bajaj Pulsar family.
While the high-volume 75-110cc and 110-125cc segments grew at single-digit rates, the 150-200cc, 200-250cc and 250-350cc segments all posted double-digit or triple-digit growth.
For the Ronin, sales have grown month-on-month through Q1 FY27 – 8,981 units in April, 9,481 in May and 10,157 in June – and if that trajectory holds, the Ronin looks on course to exceed 1 lakh annual sales for the first time in FY27, having posted its best-ever fiscal in FY26 with 80,518 units.
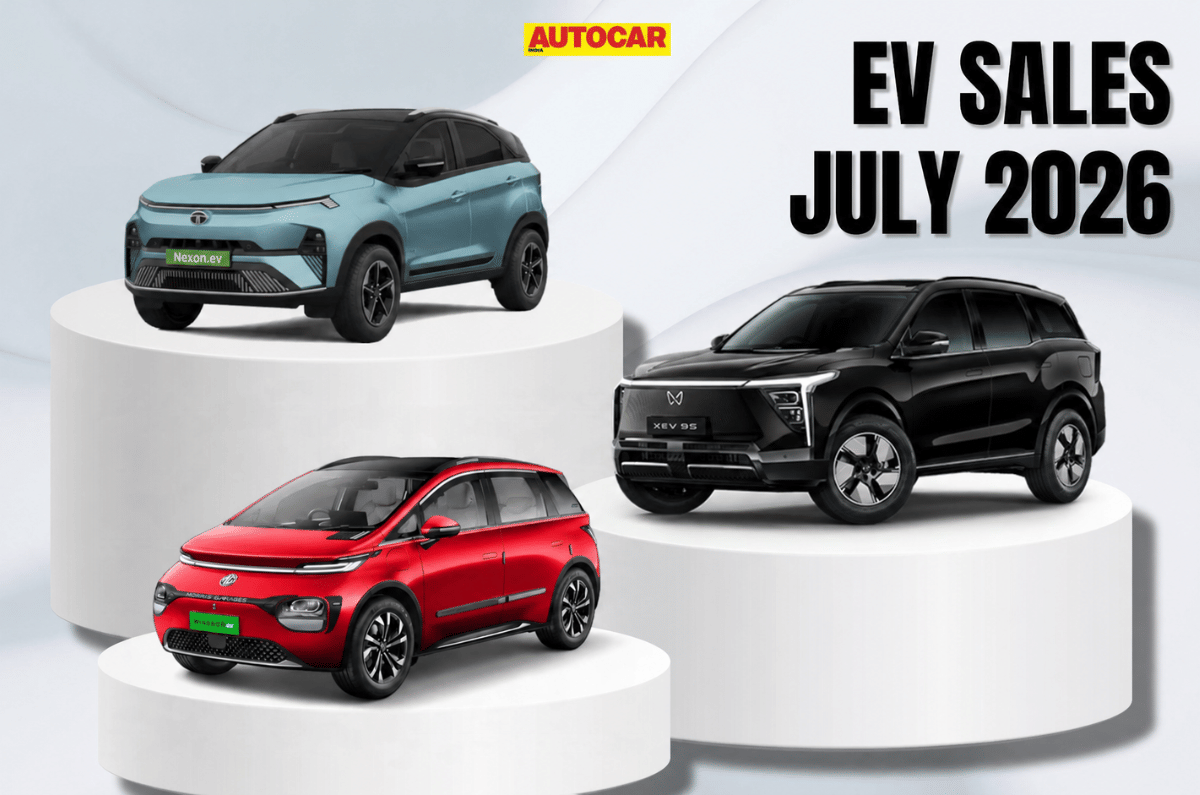
Retail sales of electric passenger vehicles breached the 30,000-unit mark for the second month in a row in July 2026. After a record 33,307 units in June, buyers took home a total of 32,609 EVs last month, up 83 percent year-on-year, as per Vahan data. Tata Motors recorded its highest-ever monthly EV sales, while Mahindra and Maruti Suzuki posted their second-highest monthly totals.
Tata Motors
July 2026: 13,578 units, up 102 percent YoY
Tata Motors, which recently expanded its EV portfolio with the launch of the Sierra EV, recorded its best-ever monthly retail sales of 13,578 units in July. This is 102 percent higher than July 2025 and 6 percent more than June 2026. The company also crossed the 40 percent EV market share mark after a long gap. Its 42 percent share in July is 4 percentage points higher than the 38 percent it held a year ago, despite growing competition.
July was also the second consecutive month that Tata sold more than 12,000 EVs, after 12,756 units in June. Cumulative sales between April and July stood at 46,697 units, up 108 percent YoY.
Mahindra
July 2026: 7,677 units, up 125 percent YoY
Mahindra crossed the 7,000-unit mark for the second month in a row. It sold 7,677 electric SUVs in July, up 125 percent over July 2025, although this was 498 units fewer than June. The performance helped Mahindra increase its market share to 22 percent, up from 19 percent a year ago. The BE 6 and XEV 9e continue to see strong demand. The XEV 9S, Mahindra’s first three-row born-electric SUV, has further strengthened its EV line-up.
JSW MG Motor India
July 2026: 5,642 units, down 4 percent YoY
JSW MG Motor India sold 5,642 EVs in July, down 4 percent YoY and 9 percent lower than June 2026. Its market share stood at 16 percent, down sharply from 33 percent in July 2025. The Windsor EV continues to be MG’s best-selling model.
Maruti Suzuki
July 2026: 1,590 units
Maruti Suzuki sold 1,590 e Vitaras in July. This was the fifth consecutive month of four-digit sales, following March, April and May. However, July sales were 20 percent lower than June, which remains the model’s best month so far. Until now, domestic sales of the e Vitara were limited because a larger share of production was allocated for exports. This is expected to change with the start of production at a new fourth manufacturing line at Maruti Suzuki’s Hansalpur, Gujarat plant. The expanded facility now builds the e Vitara, Fronx, Baleno and Swift.
Vinfast India
July 2026: 1,478 units
Vinfast ranked fifth among the country’s 18 electric passenger vehicle manufacturers. The Vietnamese carmaker recorded its highest-ever monthly sales in July with 1,478 units, surpassing its previous best of 1,448 units in June by 30 units, or 2 percent. This gave the company a 4 percent EV market share in July.
According to wholesales data, the VF Limo Green (for commercial use) is currently its best-selling model. In Q1 FY2027 (April-June 2026), SIAM wholesale data shows the Green Limo accounted for 2,746 units, or 46 percent of Vinfast India’s total sales of 6,001 units, well ahead of the VF7, VF6 and MPV7.
BYD India
July 2026: 742 units, up 47 percent YoY
BYD sold 742 EVs in July, up 47 percent over July 2025. However, sales were 20 percent lower than June 2026, which remains the company’s best monthly performance so far. On July 1, BYD increased prices of its EVs by 1-2 percent, marking its second price hike of the year after the one on May 1. The company’s current line-up includes the Atto 3 SUV, e-Max 7 MPV, Seal sedan and Sealion 7 SUV. BYD has also confirmed that it will launch the Seal U PHEV later this year.
Hyundai
July 2026: 565 units, down 21 percent YoY
Hyundai sold 565 EVs in July, down 21 percent compared to 719 units in July 2025. However, on a month-on-month basis, sales were up 51 percent from the 374 units sold in June 2026. At present, Hyundai’s EV portfolio in India consists of just two models: the Creta Electric and the Ioniq 5.
Kia India
July 2026: 464 units, up 614 percent YoY
Kia ranked eighth with retail sales of 464 units in July. This is a 614 percent year-on-year increase over the low base of 65 units in July 2025. However, sales were 14 percent lower than 539 units in June 2026. Kia’s monthly sales have improved since the launch of the mass-market Carens Clavis EV MPV, which joined the much more expensive EV6 and EV9, both of which are imported as CBUs.
Toyota Kirloskar Motor
July 2026: 123 units
Toyota delivered 123 units of the Urban Cruiser Ebella in July. This placed the company 11th among the country’s electric passenger vehicle manufacturers. The Urban Cruiser Ebella is the badge-engineered version of the Maruti e Vitara, and it is currently available in a single E3 variant.
Carmaker
July 2026
July 2025
YoY Change (in percent)
Tata Motors
13,578
6,712
102
Mahindra
7,677
3,416
125
JSW MG Motor
5,642
5,900
-4
Maruti Suzuki
1,590
–
–
Vinfast
1,478
–
–
BYD
742
505
47
Hyundai
565
719
-21
Kia
464
65
614
BMW
367
270
36
Mercedes-Benz
163
115
42
Toyota
123
–
–
Tesla
115
–
–
Stellantis
51
68
-25
Volvo
48
42
14
Porsche
6
8
-25
Audi
0
1
-100
Rolls-Royce
0
2
-100
Jaguar Land Rover
0
0
–
Total
32,609
17,823
83
Luxury electric carmakers sell record units in July
Demand for luxury electric cars continued to grow in July 2026. Carmakers in this segment sold 699 EVs, up 60 percent year-on-year. However, sales were 17 percent lower than the record 847 units sold in June 2026. BMW and Mercedes-Benz continued to lead the luxury EV market, while Tesla India crossed the 100-unit mark for the first time with its highest-ever monthly sales.
BMW India
BMW remained the leader in the luxury EV segment with 367 units. This is 36 percent higher than 270 units sold in July 2025, giving the brand a 52 percent segment share. However, sales were 29 percent lower than 517 units in June 2026. After topping the luxury EV segment in FY2026 with a record 3,898 units, BMW has sold 1,606 EVs between April and July, which is 41 percent of its FY2026 total.
Mercedes-Benz
Mercedes- Benz sold 163 EVs in July, up 42 percent from 115 units in July 2025. However, this was 33 percent lower than the 243 units sold in June 2026. The brand’s growth has been supported by the launch of the CLA electric sedan at the end of April.
Tesla
Tesla recorded its highest-ever monthly sales in India, selling 115 Model Ys in July. This is a 203 percent increase over 38 units sold in June 2026. Its luxury EV market share also rose sharply from 4 percent in June to 16 percent in July, allowing it to move ahead of Volvo Auto India. The strong growth follows Tesla India’s decision to reduce the price of the Model Y by Rs 9 lakh, bringing the starting price down to Rs 50.89 lakh, ex-showroom.
Volvo
Volvo, now ranked fourth in the luxury EV segment, sold 48 EVs in July. This is 14 percent higher than 42 units sold in July 2025 and 23 percent more than the 39 units sold in June 2026. The Swedish carmaker increased prices of its models by up to Rs 1 lakh from May 1, citing ongoing global supply chain challenges and fluctuations in foreign exchange rates. Volvo’s market share stood at 7 percent in July, down from 10 percent a year ago.
Porsche, Audi and Rolls-Royce
Porsche sold 6 EVs in July. According to Vahan data, Audi, Rolls-Royce and JLR India did not sell a single EV during the month.
Overall, luxury EV makers accounted for 2.14 percent of the 32,609 electric passenger vehicles sold in July 2026, compared to 2.45 percent in July 2025 and 2.54 percent in June 2026.
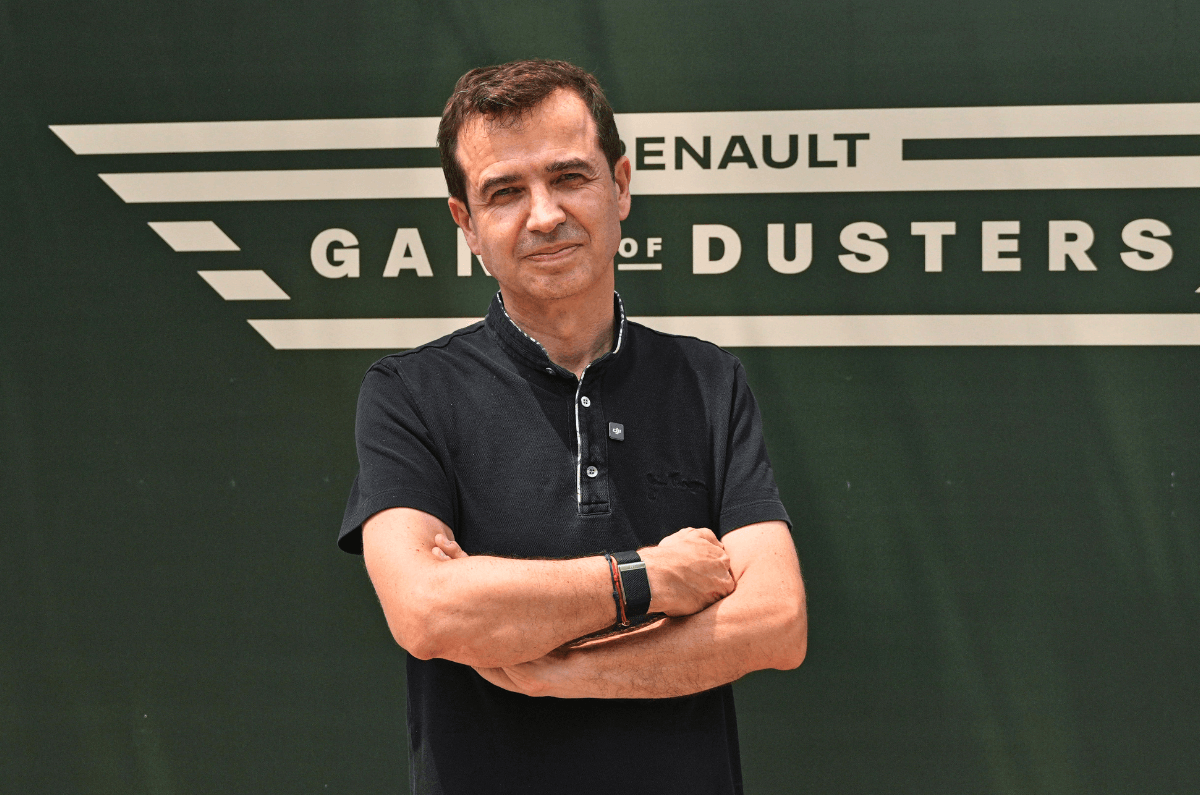
Renault Group India CEO Stephane Deblaise took charge of the company in September last year, and since then, the carmaker has been busy expanding and refreshing its India line-up. In this interview, Deblaise talks about the response to the new Renault Duster and the possibility of a more affordable automatic variant, the company’s upcoming product plans, progress on the Bridger compact SUV concept, and how Renault plans to strengthen its position in the Indian market.
On the response to the 1.0-litre Duster
It’s still early, so we don’t know the exact response, but it’s a key part of our phased strategy, which was to first focus on the 160hp DCT that is the high-end version in the ICE car. And then we want to introduce the 100hp, the more ‘regular’ car, which is less expensive. That Rs 10.5 lakh price is very, very good for people who want to enter the B+ SUV segment, and it has very good fuel efficiency. Moreover, the Duster is a very good car, and people are loyal to good cars, so we are expecting the Duster to do well on the whole.
On the slow rate of Duster bookings and deliveries
So, at Renault, we don’t overstate or overpromise. We won’t say we have 60,000 people waiting and, after that, you would discover that we did not do 60,000 deliveries. Some people do that; we don’t. We are very serious and would prefer to focus on one (variant), and then another, and a third, so in this way people keep speaking about it. For the hybrid, we were not ready; that’s why it is coming later, but with the 160hp and 100hp Duster, we wanted to focus first on the high-end and then the lower version. You know, we were in a little bit of a hibernation, and you can’t go from that to summer in one day. I think it’s good to build up step by step.
On the possibility of a 1.0-litre automatic
I am not saying what gearbox or even the engine, but what I can say is that very soon we will introduce a new, less expensive version with an automatic. It was not planned at the beginning, but since we launched the new Duster, we have been having a lot of queries about this from customers. Plus, if you look at the pricing of all the models and variants we currently have, there is a gap between the manual variants and the first automatic version.
On the rest of the Renault portfolio
I arrived in India on the 1st of September, and on the 16th of October I went to Paris to validate our India plan, and all the programmes that we decided to pursue were validated. Then, as you know, we communicated this in April this year. The programmes are completely running as per our expectations and on time. On the Renault Group Entry Platform (RGEP), we have made many modifications and carried out re-engineering to bring in new engines, new equipment and other things that you have requested. They are now finally coming. Next year will be a blowout of new products.
On the brand’s new design centre in India
The India R&D centre is playing a very big role in our local as well as global plans. When I arrived, I was requested to bring together the three entities we had, which were all separate: one dedicated to sales, one to engineering, and one dedicated to manufacturing, which was along with Nissan. Now we have all three together under one leadership – mine – and this helps a lot because communication is easier and quicker, and this is improving our agility and our ability to see and respond to the market much better. This is why we will now deliver exactly what the market needs and is asking for.
On the development of the Bridger concept
This is a very important topic. It’s my project, and I am working very hard on this with our whole team. We have three meetings per week about the project, and in the coming weeks, there is a very important milestone. But I am happy to say that everything is going nicely and is on track, so I am satisfied with our progress.
Stocks to Watch: सोमवार, 3 अगस्त के कारोबार में कई शेयरों पर निवेशकों की खास नजर रहेगी। कुछ कंपनियों ने दमदार तिमाही नतीजे पेश किए हैं। कुछ को बड़े ऑर्डर और अहम कारोबारी अपडेट मिले हैं। वहीं, जुलाई ऑटो सेल्स के आंकड़ों ने भी कई ऑटो शेयरों को फोकस में ला दिया है। ऐसे में इन 20 स्टॉक्स में सोमवार को बड़ी हलचल देखने को मिल सकती है।
Maruti Suzuki
ऑटोमोबाइल सेक्टर की कंपनी मारुति सुजुकी ने जून तिमाही में मिले-जुले नतीजे पेश किए। कंपनी का शुद्ध मुनाफा 10.8% घटकर ₹3,352 करोड़ रहा, लेकिन यह बाजार के अनुमान से बेहतर रहा। वहीं, रेवेन्यू में अच्छी बढ़त दर्ज हुई। हालांकि ऑपरेटिंग मार्जिन पर दबाव बना रहा।
CDSL
डिपॉजिटरी सर्विसेज कंपनी CDSL का जून तिमाही में कंसोलिडेटेड शुद्ध मुनाफा 15% बढ़कर ₹117.51 करोड़ हो गया। आय में भी बढ़ोतरी दर्ज की गई। हालांकि, सालाना आधार पर कंपनी के मार्जिन में कुछ गिरावट देखने को मिली।
Indian Oil Corporation
सरकारी ऑयल मार्केटिंग कंपनी इंडियन ऑयल कॉर्पोरेशन (IOC) को जून तिमाही में ₹2,661.3 करोड़ का स्टैंडअलोन घाटा हुआ। यह घाटा बाजार के अनुमान से भी ज्यादा रहा। इसका मतलब कि कंपनी का प्रदर्शन उम्मीद से कमजोर रहा।
Muthoot Finance
गोल्ड लोन देने वाली एनबीएफसी कंपनी मुथूट फाइनेंस का जून तिमाही में शुद्ध मुनाफा करीब 39% बढ़ा। कंपनी की नेट इंटरेस्ट इनकम (NII) और ब्याज आय में भी मजबूत बढ़ोतरी दर्ज की गई। गोल्ड लोन कारोबार ने प्रदर्शन को सहारा दिया।
ITC
एफएमसीजी और सिगरेट कारोबार वाली कंपनी आईटीसी का स्टैंडअलोन शुद्ध मुनाफा 27.1% घटकर ₹3,578.8 करोड़ रह गया। वहीं, रेवेन्यू 14.4% घटकर ₹16,908 करोड़ पर आ गया। कंपनी का प्रदर्शन पिछले साल के मुकाबले कमजोर रहा।
Aarti Drugs
फार्मा कंपनी आरती ड्रग्स का जून तिमाही में शुद्ध मुनाफा 6.9% घटकर ₹50.17 करोड़ रह गया। हालांकि, कंपनी का रेवेन्यू 19% बढ़कर ₹702.78 करोड़ पहुंच गया। यानी बिक्री बढ़ी, लेकिन मुनाफे पर दबाव रहा।
Sarda Energy & Minerals
स्टील और पावर सेक्टर की कंपनी सारदा एनर्जी एंड मिनरल्स का जून तिमाही में कंसोलिडेटेड शुद्ध मुनाफा 5.5% बढ़कर ₹458.25 करोड़ हो गया। कंपनी ने पिछले साल के मुकाबले बेहतर प्रदर्शन किया।
GPT Infra
इंफ्रास्ट्रक्चर कंपनी GPT Infra का जून तिमाही में कंसोलिडेटेड शुद्ध मुनाफा 5% बढ़कर ₹24.63 करोड़ रहा। हालांकि, इस दौरान कंपनी की आय 3% घटकर ₹302.07 करोड़ रह गई।
NALCO
सरकारी एल्युमिनियम कंपनी NALCO ने जून तिमाही में मजबूत नतीजे पेश किए। कंपनी का मुनाफा करीब 91% और आय 39% से ज्यादा बढ़ी। बेहतर प्रदर्शन से निवेशकों की नजर इस स्टॉक पर रहेगी।
Raymond Lifestyle
लाइफस्टाइल और परिधान कंपनी रेमंड लाइफस्टाइल की आय जून तिमाही में करीब 6% बढ़ी। हालांकि, बढ़ते खर्च की वजह से कंपनी का शुद्ध घाटा बढ़ गया। इसके बावजूद EBITDA और मार्जिन में सुधार दर्ज किया गया।
Sterlite Technologies
टेलीकॉम नेटवर्क और ऑप्टिकल फाइबर कंपनी स्टरलाइट टेक्नोलॉजीज को एक घरेलू टेलीकॉम ऑपरेटर से ₹960 करोड़ का मल्टी-ईयर सप्लाई एग्रीमेंट मिला है। कंपनी अगले दो साल तक ऑप्टिकल फाइबर केबल की सप्लाई करेगी।
Marathon Nextgen Realty
रियल एस्टेट कंपनी मैराथन नेक्स्टजेन रियल्टी ने मुंबई के सेवरी माइक्रो-मार्केट में एक रेजिडेंशियल रीडेवलपमेंट प्रोजेक्ट शुरू किया है। इस प्रोजेक्ट की ग्रॉस डेवलपमेंट वैल्यू (GDV) करीब ₹450 करोड़ है। इससे कंपनी की मुंबई में मौजूदगी और मजबूत होने की उम्मीद है।
Nilkamal
प्लास्टिक फर्नीचर और मटीरियल हैंडलिंग कंपनी नीलकमल का जून तिमाही में मुनाफा 59% से ज्यादा बढ़ा। हालांकि, इस दौरान कंपनी की आय में गिरावट रही। खर्च कम होने और बेहतर ऑपरेटिंग प्रदर्शन से मुनाफा बढ़ा।
APL Apollo
स्टील ट्यूब बनाने वाली कंपनी APL Apollo का जून तिमाही में कंसोलिडेटेड शुद्ध मुनाफा 11% बढ़कर ₹263 करोड़ हो गया। पिछले साल इसी तिमाही में यह ₹237 करोड़ था।
Glenmark Pharmaceuticals
फार्मा कंपनी ग्लेनमार्क फार्मास्यूटिकल्स का जून तिमाही में कंसोलिडेटेड शुद्ध मुनाफा 930% बढ़कर ₹483 करोड़ पहुंच गया। पिछले साल इसी अवधि में कंपनी ने ₹47 करोड़ का मुनाफा कमाया था।
ABB India
इलेक्ट्रिफिकेशन और ऑटोमेशन कंपनी ABB India का दूसरी तिमाही में स्टैंडअलोन शुद्ध मुनाफा 3% बढ़कर ₹362.3 करोड़ रहा। पिछले साल इसी तिमाही में यह ₹352 करोड़ था।
Jupiter Life Line Hospitals
मल्टी-स्पेशियलिटी हॉस्पिटल चेन जुपिटर लाइफ लाइन हॉस्पिटल्स का जून तिमाही में शुद्ध मुनाफा 14.6% घटकर ₹37.5 करोड़ रह गया। पिछले साल इसी तिमाही में यह ₹43.9 करोड़ था।
Blue Dart Express
लॉजिस्टिक्स और एक्सप्रेस पार्सल कंपनी ब्लू डार्ट एक्सप्रेस का जून तिमाही में मुनाफा 81.2% बढ़ा। कंपनी ने इसका श्रेय मजबूत रेवेन्यू ग्रोथ और बेहतर ऑपरेटिंग प्रदर्शन को दिया।
NCC
इंफ्रास्ट्रक्चर कंपनी NCC को जुलाई में ₹1,052.71 करोड़ के तीन नए ऑर्डर मिले हैं। ये ऑर्डर कंपनी के बिल्डिंग्स और वॉटर डिविजन से जुड़े हैं। इससे कंपनी की ऑर्डर बुक और मजबूत होगी।
Powerica
पावर सॉल्यूशंस कंपनी पावरिका ने Gujarat Urja Vikas Nigam Ltd (GUVNL) के साथ 100 मेगावाट विंड पावर प्रोजेक्ट के लिए पावर परचेज एग्रीमेंट (PPA) साइन किया है। इससे कंपनी के रिन्यूएबल एनर्जी कारोबार को मजबूती मिलने की उम्मीद है।
July Auto Sales
ऑटो सेक्टर की कई कंपनियों ने जुलाई में मजबूत बिक्री दर्ज की। Hero MotoCorp की बिक्री 19% बढ़कर 5.33 लाख यूनिट, Maruti Suzuki की 33.7% बढ़कर 2.41 लाख यूनिट, Hyundai की 25.4% बढ़कर 75,360 यूनिट और Mahindra & Mahindra की कुल बिक्री 1.04 लाख यूनिट रही। Tata Motors की पैसेंजर व्हीकल बिक्री अनुमान से बेहतर रही। Eicher Motors की Royal Enfield बिक्री 34% बढ़ी।
Disclaimer: यहां मुहैया जानकारी सिर्फ सूचना के लिए दी जा रही है। यहां बताना जरूरी है कि मार्केट में निवेश बाजार जोखिमों के अधीन है। निवेशक के तौर पर पैसा लगाने से पहले हमेशा एक्सपर्ट से सलाह लें। मनीकंट्रोल की तरफ से किसी को भी पैसा लगाने की यहां कभी भी सलाह नहीं दी जाती है।
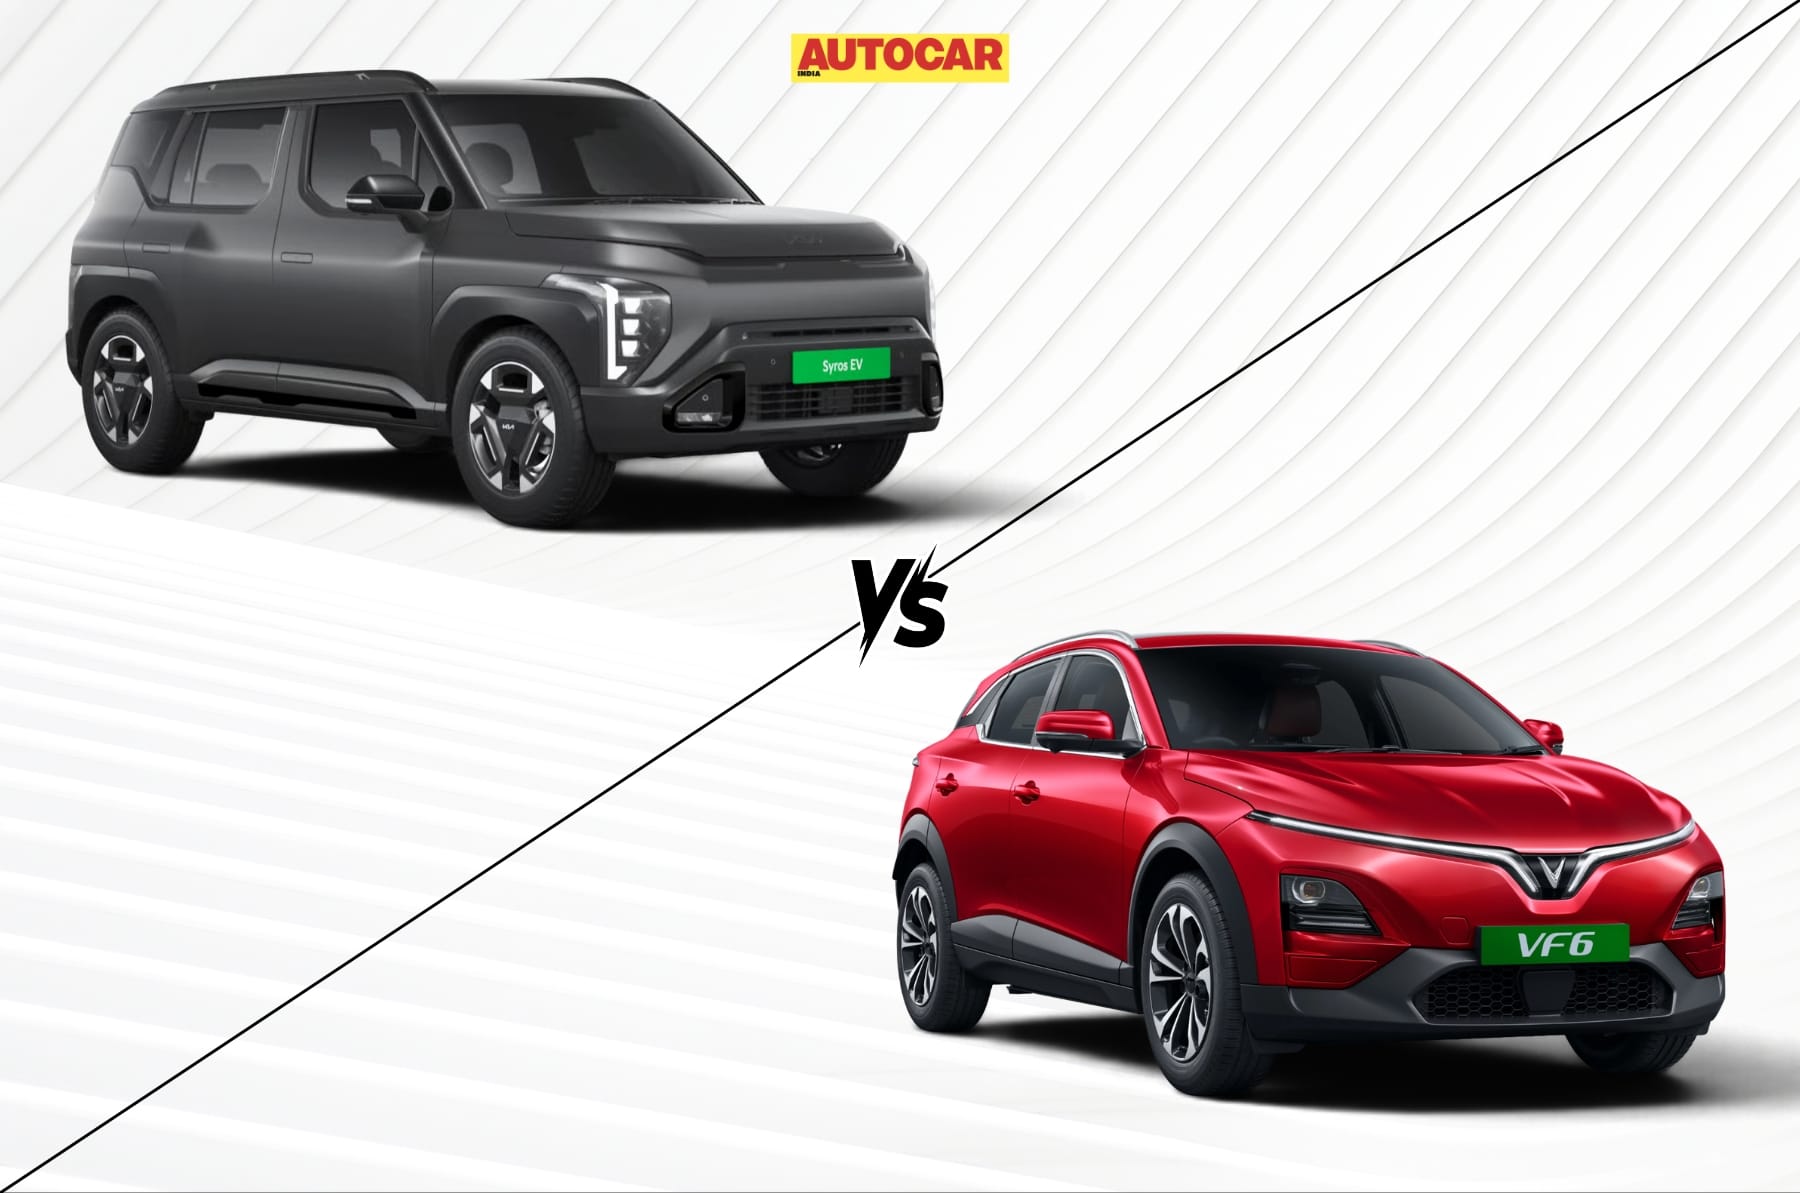
The Kia Syros EV and Vinfast VF6 are the most affordable electric vehicles from their respective brands. The premium Kia offering is sold in the compact SUV space, one below the VF6’s midsize SUV segment. So, can it match or even outdo the larger VF6 when it comes to specifications and features? We compare the Kia Syros EV X-Line ER and Vinfast VF6 Wind Infinity top-spec variants to find out.
Kia Syros EV X-Line ER vs Vinfast VF6 Wind Infinity: Dimensions
Syros EV
VF6
Length (mm)
3,995
4,241
Width (mm)
1,805
1,834
Height (mm)
1,670
1,615
Wheelbase (mm)
2,550
2,730
Ground clearance (mm)
197
190
Frunk (L)
16
No
Boot space (L)
390-465
423
Wheel size (in)
17
18
Clearly, the Vinfast VF6 is the larger SUV between the two. It is 246mm longer, 29mm wider and has a 180mm longer wheelbase than the Kia Syros EV. However, the Syros is 55mm taller and offers a 7mm higher ground clearance. It also gets a 16-litre frunk, a feature missing on the VF6. In terms of luggage space, the VF6 offers 423 litres of boot space, but the Syros EV can hold up to 465 litres when its sliding rear seats are pushed forward, although capacity drops to 390 litres with the seats in their rearmost position. The VF6 also rides on larger 18-inch alloy wheels, compared to the 17-inch units on the Syros EV.
Kia Syros EV X-Line ER vs Vinfast VF6 Wind Infinity: Powertrains
Syros EV
VF6
Battery size (kWh)
51.4
59.6
Electric motor setup
Single motor
Single motor
Drive layout
FWD
FWD
Power (hp)
171
204
Torque (Nm)
255
310
Claimed 0-100kph time (s)
8.1
8.9
ARAI range (km)
526
463
The two SUVs use a single-motor, front-wheel-drive setup, but the VF6 has the bigger 59.6kWh battery pack, compared to the Syros EV’s 51.4kWh unit. It also produces 33hp more power and 55Nm more torque. Despite this, the Syros EV is quicker, with a claimed 0-100kph time of 8.1 seconds, compared to the VF6’s 8.9 seconds. It also has a clear advantage in terms of claimed driving range, offering 526km on a single charge, which is 63km more than the VF6’s 463km, despite having a smaller battery pack.
Kia Syros EV X-Line ER vs Vinfast VF6 Wind Infinity: Charging speeds
Syros EV
VF6
AC charging (10-100 percent)
4.5 hrs (11kW unit)
Time not specified (7.2kW unit)
DC fast charging (10-70 percent)
–
25 mins (100kW unit)
DC fast charging (10-80 percent)
39 mins (100kW unit)
–
Both the Syros EV and VF6 support 100kW DC fast charging. However, Kia claims a 39-minute charging time for a 10-80 percent top-up, while Vinfast’s claimed 25-minute figure is for the slightly lower 10-70 percent charging window. On the AC charging front, the Syros EV supports charging speeds of up to 11kW, taking 4.5 hours to charge from 10 to 100 percent. The VF6, meanwhile, supports up to a 7.2kW AC charger, although Vinfast has not yet revealed its charging time.
Kia Syros EV X-Line ER vs Vinfast VF6 Wind Infinity: Exterior features
Syros EV
VF6
Headlamps
LED
LED projector
Front fog lamps
LED
No
LED tail-lamps
Yes
Yes
Powered ORVMs
Yes
Yes
Alloy wheels
Yes
Yes
Flush door handles
Yes
No
Body cladding
Yes
Yes
Rear spoiler
Yes
Yes
Not a lot separates them when it comes to exterior features, with both offering LED tail-lamps, powered ORVMs, alloy wheels, body cladding and a rear spoiler. However, the VF6 comes with LED projector headlamps, while the Syros EV gets LEDs with reflectors. Another differentiation is that the Syros EV gets flush-fitting door handles, whereas the VF6 is equipped with conventional pull-type door handles.
Kia Syros EV X-Line ER vs Vinfast VF6 Wind Infinity: Interior features
Syros EV
VF6
Infotainment screen (in)
12.3
12.9
Digital driver’s display (in)
12.3
No
Climate control display (in)
5
No
Sunroof
Panoramic, openable
Panoramic, fixed
Wireless charger
Yes
Yes
Driver’s seat powered adjustment
4-way
8-way
Ventilated front seats
Yes
Yes
USB ports
2 Type C (f/r), including 1 100W (f)
2 Type A (f/r), 1 90W Type C (r)
Rear AC vents
Yes
Yes
Rear seat base ventilation
Yes
No
Climate control
Single zone
Dual zone
All window one touch up/down
Yes
Yes
Ambient lighting
Yes
Footwell only
Sound system
8-speaker Harmon Kardon
8 speakers
Apple CarPlay and Android Auto
Wireless
Wireless
Connected car tech
Yes
Yes
Rear sunshades
Yes
No
Rear centre armrest
Yes
Yes
Sliding, reclining rear seats
Yes
No
Speaking of interior features, both are well equipped and offer a wireless phone charger, ventilated front seats, connected car technology, one-touch up/down function for all windows, wireless Apple CarPlay and Android Auto and an 8-speaker sound system. The VF6 gets a slightly larger 12.9-inch infotainment screen, an 8-way power-adjustable driver’s seat and dual-zone climate control.
The Syros EV, meanwhile, stands out with a 12.3-inch digital driver’s display, a 5-inch climate control display, an openable panoramic sunroof, rear sunshades, rear seat base ventilation, and sliding and reclining rear seats. It also gets USB Type-C ports throughout the cabin, while the VF6 has Type-A ports at the front and rear, and only a single 90W Type-C port for rear passengers. Additionally, the Syros EV features a premium Harman Kardon sound system and more comprehensive ambient lighting (dashboard, doors and footwell area), whereas the VF6 offers just footwell lighting.
Kia Syros EV X-Line ER vs Vinfast VF6 Wind Infinity: Driving features
Syros EV
VF6
Drive modes
Eco, Normal, Sport
Eco, Normal, Sport
Household-style interior 3-pin socket
Yes
No
Regen braking
Yes
Yes
Paddleshifters for regen
Yes
No
Adaptive cruise control
Yes
Yes
Differences here are less, save for the Syros EV’s household-style 3-pin power socket to power certain electrical devices, along with steering-mounted paddle shifters to adjust the level of regenerative braking. Regen levels can be adjusted via the touchscreen on the VF6, but an internal V2L charging socket is absent here. Drive modes and adaptive cruise control are offered by both models.
Kia Syros EV X-Line ER vs Vinfast VF6 Wind Infinity: Safety features
Syros EV
VF6
Bharat NCAP rating
Yet to be tested
5 stars
Airbags
6
7
ABS with EBD
Yes
Yes
Electronic stability program
Yes
Yes
Hill-start assist
Yes
Yes
Tyre pressure monitoring system
Yes
Yes
360-degree camera
Yes
Yes
Front parking sensors
Yes
Yes
Electronic parking brake
Yes
Yes
Rain-sensing wipers
No
Yes
Auto-dimming IRVM
Yes
Yes
Isofix child seat anchors
Yes
Yes
Rear wiper, defogger
Yes
Yes
Disc brakes
Front, rear
Front, rear
Level 2 ADAS
Yes
Yes
Again, not much separates the them when it comes to safety kit. Both offer ABS with EBD, electronic stability control, hill-start assist, TPMS, a 360-degree camera, front parking sensors, an electronic parking brake, an auto-dimming IRVM, ISOFIX child seat anchors, front and rear disc brakes, and Level 2 ADAS.
The VF6, however, gets seven airbags, one more than the Syros EV’s six, along with rain-sensing wipers. It has also secured a full 5-star Bharat NCAP safety rating. The Syros EV’s Bharat NCAP crash test rating, meanwhile, is yet to be revealed at the time of writing, but it is likely to score a 5-star rating like its ICE counterpart.
Kia Syros EV X-Line ER vs Vinfast VF6 Wind Infinity: Prices and verdict
Syros EV
VF6
Price (in Rs lakh)
20
19.99
There’s no doubt that both the Kia Syros EV and Vinfast VF6 are feature-rich electric SUVs. However, despite being positioned a segment below the VF6, the Syros EV makes a strong case for itself with its overall package. It offers several features aimed at pampering the rear seat passengers, including sliding and reclining seats with ventilation (seat base only), sunshades and an openable panoramic sunroof. While it has a smaller footprint than the VF6, we found in our review that the Syros EV still offers a spacious cabin, helped by its boxy design and good interior packaging.
The Syros EV also has an advantage when it comes to claimed driving range. Despite using a smaller battery pack, it offers a higher single charge range, an important factor for most EV buyers. While both SUVs are priced very close to each other at the top-end, the Syros EV is clearly on the expensive side for its segment. However, the overall package goes a long way towards justifying its price. Buyers can also reduce the upfront cost by quite a lot by opting for the battery as a service (BaaS) scheme with the electric Syros, though this option is not available with the VF6.
Another advantage for the Syros EV is Kia’s wider sales and service network across the country, along with its stronger brand recognition among buyers. Vinfast, on the other hand, is still new to the market, with a relatively limited sales and service network. This could also play an important role in the overall ownership experience.
Risks of MTF: मान लीजिए कि स्टॉक मार्केट में MTF (मार्जिन ट्रे़डिंग फैसिलिटी) चुनने वाले हर 30 में से एक को एक ही हफ्ते में मैसेज आए, ‘मार्जिन काल, फंड डालिए, नहीं तो हम बेच देंगे’, तो क्या होगा, हड़कंप मच जाएगा न। वैसे यह कल्पना नहीं रह गई और पिछले महीने जुलाई में दक्षिण कोरिया में ऐसा ही हुआ। अब सवाल ये है कि क्या भारत में भी ऐसा कुछ हो सकता है। सैमको सिक्योरिटीज के सीईओ और फाउंडर जिमीत मोदी का मानना है कि रिस्क तो बढ़ा है। उनका कहना है कि एनालिसिस में गलती हुई तो मार्केट माफ कर सकता है लेकिन अत्यधिक लेवरेज की गलती शायद माफ न हो। उनका कहना है कि दक्षिण कोरिया के निवेशकों ने यह सबक सीखने के लिए सिर्फ चार हफ्ते में करीब ₹12,000 करोड़ गंवा दिए और भारतीय निवेशकों के पास अभी भी यह मौका है कि वे बिना नुकसान उठाए इस अनुभव से सीख लें।
क्या है मामला
शुरुआत में सब शानदार चल रहा था। चिप से जुड़े स्टॉक में तेजी के चलते दक्षिण कोरिया का कोस्पी (KOSPI) इंडेक्स उछलकर जून में रिकॉर्ड हाई पर पहुंच गया। साथ ही कोरिया का एमटीएफ यानी मार्जिन ट्रेडिंग फैसिलिटी का लोन बुक रिकॉर्ड 38.6 ट्रिलियन वान (KRW) यानी ₹2.56 लाख करोड़ पर पहुंच गया जोकि एक साल में करीब डबल हो गया। खास बात ये है कि इस उधार लिए गए पैसे का बड़ा हिस्सा सिर्फ दो शेयरों, सैमसंग इलेक्ट्रॉनिक्स (Samsung Electronics) और एसके हाइनिक्स (SK Hynix), में लगाया गया था जिनका कोस्पी इंडेक्स में आधे से अधिक हिस्सा है।
फिर बाजार ने गोता लगाया और गिरावट इतनी तेज रही कि कोस्पी जून महीने के रिकॉर्ड हाई से करीब 40% टूट गया। इसके बाद करीब 12 लाख रिटेल अकाउंट्स को मार्जिन कॉल मिले और इनमें से 3.20 लाख-3.60 लाख निवेशकों के शेयर जबरन बेच दिए गए। जबरन बिकवाली से शेयरों की कीमतें और नीचे आईं, जिससे और अधिक निवेशकों को मार्जिन कॉल मिले। इससे खुदरा निवेशकों को करीब 2.15 ट्रिलियन वान (KRW) यानी करीब ₹12 हजार करोड़ की दौलत सिर्फ एक महीने में खत्म हो गई। सबसे अधिक नुकसान 20 से 30 साल की उम्र के निवेशकों को हुआ, जिनकी हिस्सेदारी इस पूरे नुकसान में 62% रही।
भारत के लिए क्या है चेतावनी
भारतीय मार्केट में एमटीएफ बुक FY23 में लगभग ₹25,000 करोड़ से बढ़कर अब ₹1.44 लाख करोड़ से अधिक हो गया है यानी तीन साल में लगभग छह गुना बढ़ोतरी। इस पर सेबी की नजर तो है और सेबी ने एमटीएफ पर एक्सपोजर लिमिट और रिस्क से जुड़े नियम का प्रस्ताव पेश किया है, जिन्होंने हमें कोरिया जैसी बुरी स्थितियों से पहले ही बचा लिया है। हालांकि ध्यान दें कि रेगुलेशन सिर्फ नियम बनाता है, सही फैसला लेने की समझ नहीं देता और वह जिम्मेदारी निवेशकों की खुद की है। यहां ऐसे ही कुछ रिस्क के बारे में बताया जा रहा है, जिन पर ध्यान देना चाहिए-
कम लिक्विडिटी वाले शेयरों के लिए भी लेवरेज: ब्रोकर करीब 1,500 शेयरों पर एमटीएफ की फैसिलिटी दे रहे हैं। फिलहाल इंडस्ट्री के एमटीएफ बुक का एक बड़ा हिस्सा एफएंडओ सेगमेंट से बाहर के ऐसे स्मॉल-कैप और मिड-कैप शेयरों में है जो लगातार लोअर सर्किट में जा सकते हैं, जिससे अचानक मुश्किल आने पर निकलने का कोई रास्ता नहीं बचता। कोरिया के निवेशकों के शेयर कम से कम किसी कीमत पर तो बिके थे, लोअर सर्किट पर तो शेयर बिकेगा भी नहीं।
नया सिस्टम: एटीएफ का चलन सिर्फ 3-4 साल में तेजी से बढ़ा है। कोरोना महामारी के बाद अभी यहां कोस्पी जैसी स्थिति आई नहीं है जिसका मतलब है कि ₹1.44 लाख करोड़ के लेवरेज ने असली आंधी का सामना नहीं किया है।
युवाओं की अधिक संख्या: एटीएफ का इस्तेमाल कोरियाई मार्केट की तरह अधिकतर युवा ही कर रहे हैं जिन्होंने अधिकतर सिर्फ चढ़ता हुआ मार्केट ही देखा है।
पांच बातों का रखें ख्याल
लेवरेज लोन है, स्ट्रैटेजी नहीं: शेयर परफॉर्म करे या नहीं, सालाना 10-15% की दर से ब्याज देना पड़ता है। 50% मार्जिन पर खरीदे गए स्टॉक से फंडिंग कॉस्ट निकालने के लिए ही सालाना 5% से ज़्यादा रिटर्न मिलना ज़रूरी है। उधार के पैसे से कोई खराब निवेश नहीं बन जाता, बल्कि और खराब हो जाता है।
कुछ ही स्टॉक्स में न लें लवरेज: दक्षिण कोरिया की सबसे बड़ी गलती केवल लीवरेज लेना नहीं था, बल्कि सिर्फ दो शेयरों में भारी निवेश करना था। अगर आपके भी एमटीएफ वाले अधिकतर निवेश सिर्फ दो-तीन स्टॉक्स में हैं, जिनमें बाकी लोग भी पैसे डाल रहे हैं तो गिरावट आने पर सभी लोग एक साथ बेचने की कोशिश करेंगे और ऐसी स्थिति में नुकसान अधिक तेजी से बढ़ सकता है।
मार्जिन कॉल आ सकती है खराब समय में: अच्छी कंपनी में भी एमटीएफ निवेश से घाटा हो सकता है। इसकी वजह ये है कि मार्जिन कॉल हमेशा सबसे खराब समय में आती है। लोअर सर्किट में ब्रोकर को भी खरीदार नहीं मिलेगा और मार्केट अगर अनुमान से अधिक समय तक नीचे आया और गिरवी रखा पैसा यानी कोलैटरल उतने समय के लिए पर्याप्त न हो तो दिक्कत हो सकती है।
अधिकतम मुनाफा नहीं, बल्कि लंबे समय तक टिके रहने की योजना: हर मार्केट में कभी न कभी 25% से 30% की गिरावट आती ही है। दक्षिण कोरिया में यह गिरावट सिर्फ चार सप्ताह में आ गई। ऐसे में एमटीएफ का इस्तेमाल से पहले खुद से एक प्रश्न पूछे कि क्या अगर अगले महीने मेरा शेयर 30% गिर जाए, तो क्या मैं बिना किसी अन्य निवेश को बेचे इस स्थिति से निकल सकता हूं? अगर इसका जवाब ना में है तो आपका निवेश बहुत बड़ा है।
खुद से जरूर पूछें एक सवाल: अगर आप किसी शेयर को बिना उधार लिए हुए पैसे के साथ लॉन्ग टर्म तक नहीं रख सकते, तो इसे उधार लेकर भी नहीं खरीदना चाहिए क्योंकि लेवरेज सिर्फ उस भरोसे को बढ़ाना चाहिए जो आपके पास पहले से है। यह उस भरोसे की जगह नहीं ले सकता जो आपके पास है ही नहीं।
डिस्क्लेमर: मनीकंट्रोल.कॉम पर दिए गए सलाह या विचार एक्सपर्ट/ब्रोकरेज फर्म के अपने निजी विचार होते हैं। वेबसाइट या मैनेजमेंट इसके लिए उत्तरदायी नहीं है। यूजर्स को मनीकंट्रोल की सलाह है कि कोई भी निवेश निर्णय लेने से पहले हमेशा सर्टिफाइड एक्सपर्ट की सलाह लें।
Market Outlook: दो हफ्ते से जारी गिरावट के सिलसिले को तोड़ते हुए निफ्टी मिडकैप 100 और निफ्टी स्मॉलकैप 100 पिछले कारोबारी हफ्ते 2-2% से अधिक मजबूत हुए। इसे कंपनियों की जून तिमाही के उम्मीद से बेहतर नतीजे, वैश्विक स्तर पर अनिश्चितताओं के कम होने, कच्चे तेल की कीमतों में बड़ी गिरावट, बेहतर मॉनसून, आईआईपी के उम्मीद से बेहतर आंकड़े और विदेशी संस्थागत निवेशकों (FIIs) की बिकवाली से अधिक खरीदारी से सपोर्ट मिला। पिछले हफ्ते सेंसेक्स 2,034.87 प्वाइंट्स यानी 2.67% मजबूत होकर 78,094.64 तो निफ्टी 616.15 प्वाइंट्स यानी 2.59% चढ़कर 24,383.60 पर बंद हुआ है।
पिछले कारोबारी हफ्ते निफ्टी मिडकैप 100 इंडेक्स 2% से अधिक चढ़कर अपने 63,183.35 के रिकॉर्ड हाई के करीब पहुंच गया। इस पर कोफोर्ज, लौरस लैब्स, स्विगी, कंटेनर कॉर्पोरेशन ऑफ इंडिया (CCI) और अशोक लेलैंड टॉप गेनर्स रहे और पिछले हफ्ते इनमें 10% से अधिक की तेजी आई। वहीं दूसरी तरफ सुजलॉन एनर्जी, फीनिक्स मिल्स, बिलियनब्रेन्स गैराज वेंचर्स (ग्रो), बैंक ऑफ इंडिया और एलआईसी हाउसिंग फाइनेंस टॉप लूजर्स रहे।
पिछले कारोबारी हफ्ते निफ्टी स्मॉलकैप 100 भी 2.6% बढ़कर अपने 52-हफ्ते के हाई 19,470.50 के करीब पहुंच गया। रेडिंगटन, केन्स टेक्नोलॉजी इंडिया, फर्स्टसोर्स सॉल्यूशंस, ब्रिगेड एंटरप्राइजेज, एफ्ल 3i, आईआईएफएल फाइनेंस, केफिन टेक्नोलॉजीज और आईएफसीआई के शेयरों में 24% तक की तेजी आई, जबकि नुवामा वेल्थ मैनेजमेंट, डेटा पैटर्न्स (इंडिया), ग्रेट ईस्टर्न शिपिंग कंपनी और सिटी यूनियन बैंक टॉप लूजर्स रहे।
सेक्टरवाइज पिछले कारोबारी हफ्ते सबसे मजबूत निफ्टी आईटी हुई जिसमें 6.75% की तेजी आई। वहीं इस दौरान निफ्टी मीडिया 5.97%, निफ्टी ऑटो 5.61%, निफ्टी फार्मा 3.86%, निफ्टी हेल्थकेयर 3.20% और निफ्टी कंज्यूमर ड्यूरेबल्स 2.89% मजबूत हुआ। वहीं निफ्टी डिफेंस और निफ्टी एनर्जी रेड जोन में बंद हुआ।
विदेशी संस्थागत निवेशकों (FIIs) ने पिछले कारोबारी हफ्ते ₹5,949.96 करोड़ के नेट शेयर खरीदकर लगातार दो हफ्तों से जारी बिकवाली का सिलसिला तोड़ दिया। वहीं घरेलू संस्थागत निवेशकों (DIIs) ने भी ₹5,387.66 करोड़ का निवेश किया। इस दौरान बीएसई पर लिस्टेड कंपनियों का मार्केट कैप ₹10 लाख करोड़ से अधिक बढ़ गया।
किस तरफ बढ़ रहा मार्केट
मोतीलाल ओसवाल फाइनेंशियल सर्विसेज के रिसर्च हेड (वेल्थ मैनेजमेंट) सिद्धार्थ खेमका के मुताबिक शेयर मार्केट में तेजी का रुख बने रहने की उम्मीद है क्योंकि घरेलू मैक्रो-इकनॉमिक हालत बेहतर है और जून तिमाही के मजबूत नतीजों से निवेशकों का भरोसा बना हुआ है। अगले कारोबारी हफ्ते मार्केट की नजर आरबीआई की मौद्रिक नीतियों के ऐलान, देश के मैन्युफैक्चरिंग और सर्विसेज पीएमआई डेटा के साथ-साथ कच्चे तेल की कीमतों और पश्चिमी एशिया में जियो-पॉलिटिकल टेंशन पर रहेगी। सिद्धार्थ के मुताबिक जून तिमाही का अर्निंग्स सीजन अलग-अलग शेयरों में हलचल बनाए रखेगा।
रेलिगेयर ब्रोकिंग के सीनियर वाइस प्रेसिडेंट अजीत मिश्र का कहना है कि तकनीकी रूप से निफ्टी ने 24,370 के आस-पास 200-दिनों के EMA की अहम रुकावट को पार करके अपने बुलिश स्ट्रक्चर को और मजबूत किया है। अजीत के मुताबिक अब यह 24,600 के लेवल की तरफ बढ़ने की अच्छी स्थिति में दिख रहा है, जो पिछले स्विंग हाई के बराबर है। अजीत के मुताबिक अगर निफ्टी इस जोन के ऊपर मजबूत स्थिति में ब्रेकआउट करता है, तो 24,800-25,000 की तरफ बढ़ने का रास्ता खुल सकता है। वहीं नीचे की तरफ 24,270 का लेवल तत्काल सपोर्ट का काम कर रहा है, और उसके बाद 24,150-24,050 का लेवल मुख्य सपोर्ट जोन है। अजीत का कहना है कि इस सपोर्ट के ऊपर हर गिरावट को खरीदारी के मौके के तौर पर देखा जा सकता है। उनका ऑटो और फार्मा सेक्टर पर भरोसा बना हुआ है।
एचडीएफसी सिक्योरिटीज के सीनियर टेक्निकल रिसर्च एनालिस्ट नागराज शेट्टी का कहना है कि निफ्टी फिलहाल 24350-24400 के लेवल के आसपास अहम रेजिस्टेंस जोन पर है जोकि 8 जुलाई का पिछला ओपनिंग डाउन गैप, 17 जुलाई का पिछला स्विंग हाई और 200-दिनों का EMA है। ऐसे में बड़ा ब्रेकआउट दिखाने से पहले रेजिस्टेंस के आसपास निफ्टी में कंसोलिडेशन या थोड़ी गिरावट देखने को मिल सकती है। हालांकि निफ्टी का अंडरलाइंग ट्रेंड पॉजिटिव बना हुआ है। नागराज का कहना है कि निफ्टी अगर 24400 के ऊपर टिकता है, तो जल्द ही यह 24600-24700 के लेवल तक जा सकता है। इसे 24200 के लेवल पर तत्काल सपोर्ट मिल रहा है।
डिस्क्लेमर: मनीकंट्रोल.कॉम पर दिए गए सलाह या विचार एक्सपर्ट/ब्रोकरेज फर्म के अपने निजी विचार होते हैं। वेबसाइट या मैनेजमेंट इसके लिए उत्तरदायी नहीं है। यूजर्स को मनीकंट्रोल की सलाह है कि कोई भी निवेश निर्णय लेने से पहले हमेशा सर्टिफाइड एक्सपर्ट की सलाह लें।
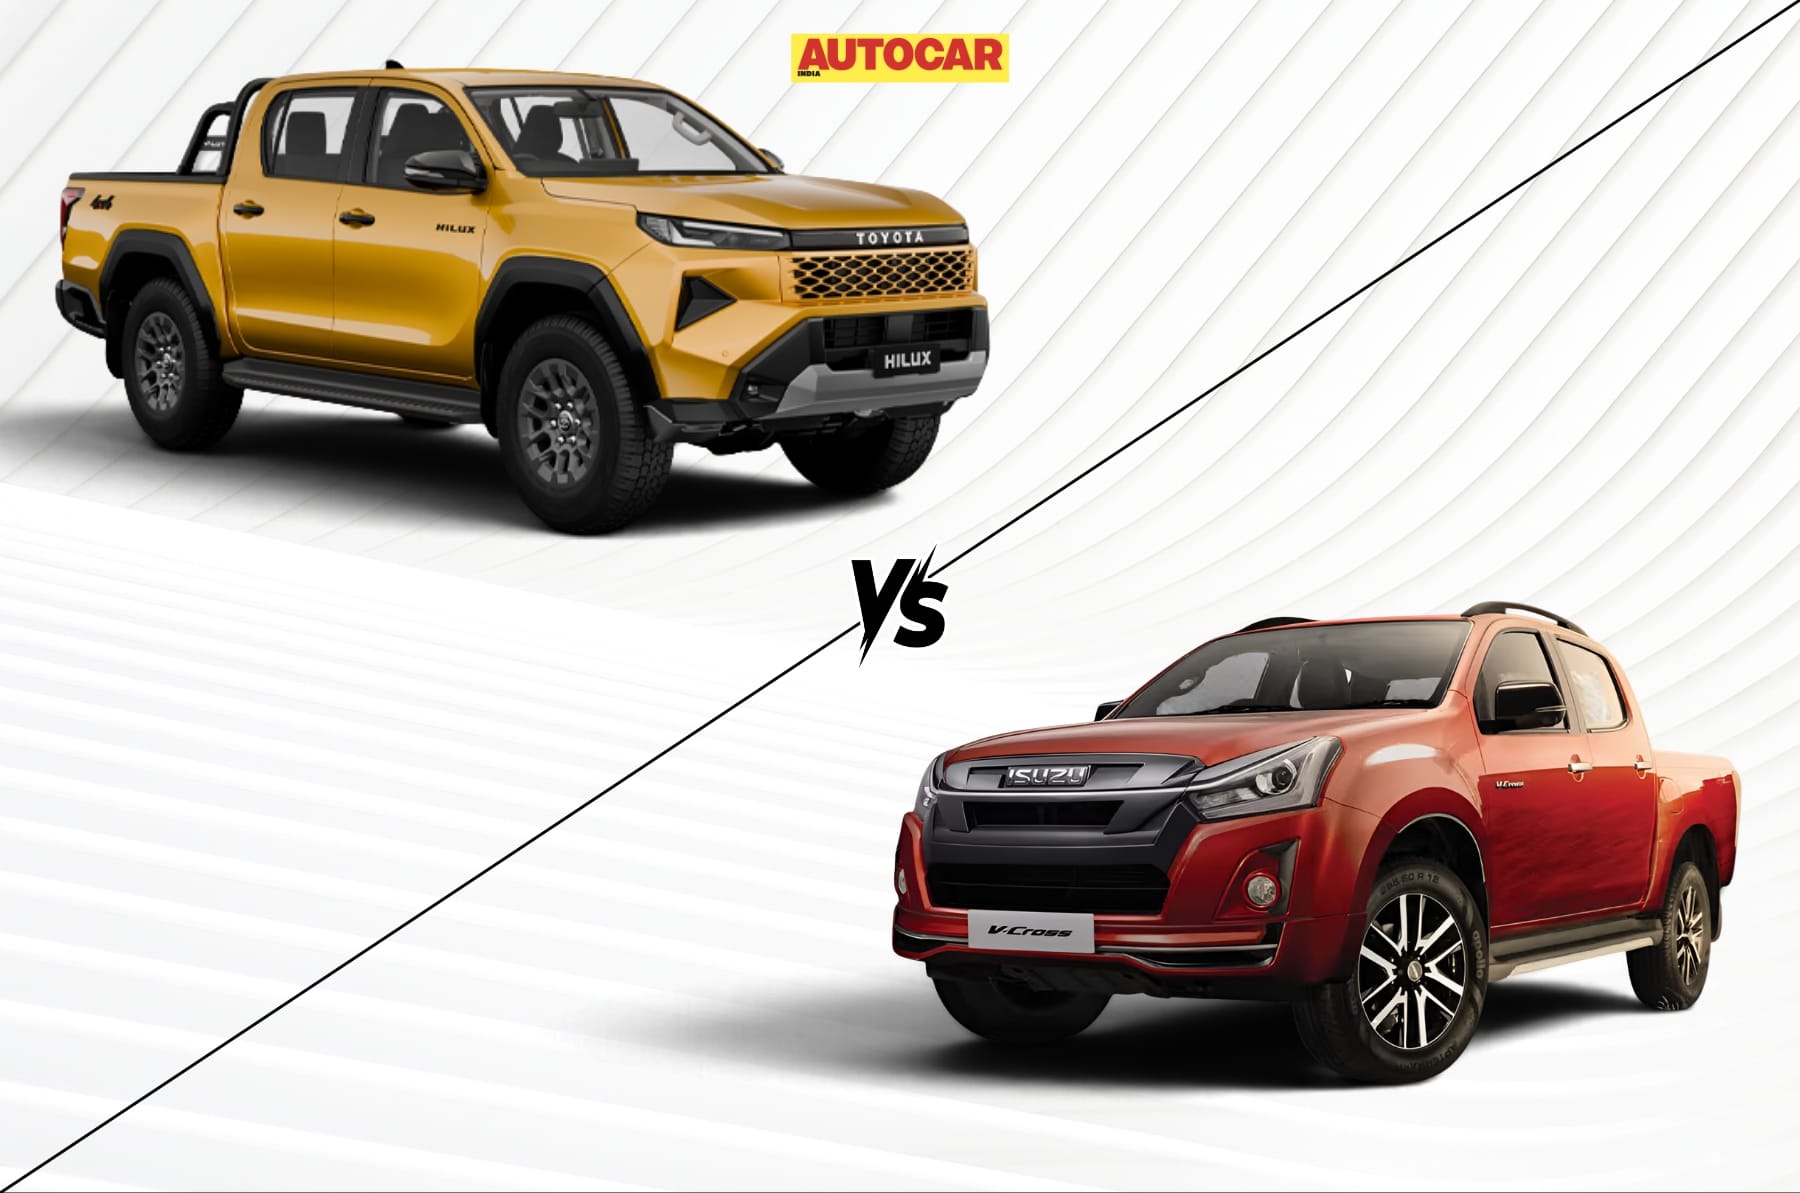
Toyota has introduced the ninth-generation Hilux with a revamped exterior and interior, along with revisions to its powertrain offering and features. In February 2026, its only other competitor, the Isuzu V-Cross, also debuted with a comprehensive update of its own. Being the only two lifestyle pickup trucks on the market, how do these fare when we compare their on-paper specifications side to side? For this comparison, we’ve chosen the Hilux’s VX 4X4 and the V-Cross’ 4WD Prestige Premium variant.
Explore full specs, features, and a price breakdown in our Hilux vs V-Cross comparison.
Toyota Hilux vs Isuzu D-Max V-Cross: Dimensions
Hilux is longer, but the V-Cross is wider and taller
Toyota Hilux vs Isuzu D-Max V-Cross: Dimensions
Toyota Hilux
Isuzu D-Max V-Cross
Difference
Length (mm)
5,320
5,295
+25
Width (mm)
1,855
1,860
-5
Height (mm)
1,815
1,855
-35
Wheelbase
3,085
3,095
-10
Wheel size (inch)
17
18
It’s only in length where the Hilux pips the V-Cross by 25mm. But the latter is 5mm wider, 35mm taller, and has a 10mm longer wheelbase. Dimensionwise, it’s the V-Cross that takes the lead overall.
Toyota Hilux vs Isuzu D-Max V-Cross: Specifications
Hilux’s larger engine develops much more power
Toyota Hilux vs Isuzu D-Max V-Cross: Specifications
Toyota Hilux
Isuzu D-Max V-Cross
Engine
Turbo-diesel
Turbo-diesel
Displacement (cc)
2,755
1,898
No of cylinders
4
4
Power (hp)
204
163
Torque (Nm)
500
360
Gearbox
6AT
6AT
Drive layout
4WD
4WD
Fuel tank (litres)
80
55
Suspension setup
Front: Double Wishbone
Rear: Leaf Spring
Front: Double Wishbone
Rear: Leaf Spring
Both the Hilux and V-Cross come powered solely by a turbo-diesel engine. While the former gets a large 2.8-litre unit, the latter comes with a 1.9-litre diesel engine. As far as outputs are concerned, the Hilux churns out 41hp and 140Nm more power and torque, respectively. Additionally, the Hilux gets a 25-litre larger fuel tank as well. What’s common on both pickups is a 6-speed automatic transmission, AWD layout and similar suspension setups.
Toyota Hilux vs Isuzu D-Max V-Cross: Driving tech
Drive and terrain modes found only on the Hilux
Toyota Hilux vs Isuzu D-Max V-Cross: Driving features
Toyota Hilux
Isuzu D-Max V-Cross
4WD with low range
Yes
Yes
Differential lock
Electronic
Electronic
Terrain modes
Yes
No
Drive modes
Eco, Normal, Sport
No
Cruise control
Manual
Manual
With 4WD on board, both the Hilux and V-Cross come with a low range transfer case and an electronic differential lock. However, it’s the Hilux that comes with the ability to fine-tune your drive experience further with drive and terrain modes.
Toyota Hilux vs Isuzu D-Max V-Cross: Exterior Features
While the Hilux gets all-LED lighting, V-Cross gets roof rails
Toyota Hilux vs Isuzu D-Max V-Cross: Exterior Features
Toyota Hilux
Isuzu D-Max V-Cross
Headlights
Auto LED
Auto projector LED
Front fog lamps
LED
Halogen
Tail-lights
LED
Halogen
DRLs
Yes
Yes
Rear fog lamp
LED
No
Door handles
Gloss black
Chrome
Powered and foldable ORVMs
Yes
Yes
Roof rails
No
Yes
Side steps
Yes
Yes
Step for load bed access
Yes
No
Gas strut for tailgate
Yes
No
Colour
Monotone
Monotone
With the updated exterior, the Hilux gains all-LED light setups. But the V-Cross, on the other hand, sports projector-LED headlamps, halogen fog lamps and tail-lamps, and misses out on a rear fog lamp. Moreover, the Hilux is the only one here with a dedicated step to access the trunk and gas struts for the tailgate. However, the V-Cross comes with roof rails and wheels a size larger than the Hilux.
Toyota Hilux vs Isuzu D-Max V-Cross: Interior Features
Hilux loaded with more tech, but V-Cross gets more convenience features
Toyota Hilux vs Isuzu D-Max V-Cross: Interior Features
Toyota Hilux
Isuzu D-Max V-Cross
Infotainment display
12.3-inch
10.3-inch
Driver’s display
7-inch
Analogue dials with MID
Android Auto, Apple CarPlay
Wireless
Wireless
Speakers
8 speakers
8 speakers
Climate control
Manual
Automatic
Seat upholstery
Fabric
Leatherette
Wireless phone charger
Yes
No
Driver’s seat adjust
6-way manual
6-way powered
Rear seat folding
60:40 split
60:40 split
Front centre armrest
Yes
Yes
Rear centre armrest
Yes
Yes
Push-button start/stop
Yes
Yes
USB ports
Type-C
Type-A and Type-C
Connected car tech
Yes
No
On the equipment front, the Hilux brings a larger infotainment screen, digital driver’s display, a wireless phone charger and connected-car tech over the V-Cross. But it misses out on convenience features like automatic climate control and a powered driver seat that’s found on the latter.
Toyota Hilux vs Isuzu D-Max V-Cross: Safety features
Hilux offers an additional airbag and front parking sensors
Toyota Hilux vs Isuzu D-Max V-Cross: Safety features
Toyota Hilux
Isuzu D-Max V-Cross
Airbags
7
6
Camera setup
360-degree
360-degree
Parking sensors
Front and rear
Rear only
ISOFIX anchorages
Yes
Yes
Disc brakes
Front only
Front only
TPMS
Yes
Yes
IRVM
Day/Night
Day/Night
Hill start assist
Yes
Yes
Hill descent control
Yes
Yes
ESC
Yes
Yes
Safety-feature-wise, the Hilux and V-Cross come well-equipped with a 360-degree camera, front disc brakes, ISOFIX mounts, day/night IRVM, hill start assist, hill descent control, and ESC. But the Hilux nudges ahead with an additional airbag and front parking sensors.
Toyota Hilux vs Isuzu D-Max V-Cross: Price and verdict
Hilux top-end pricier by Rs 6.41 lakh
Toyota Hilux vs Isuzu D-Max V-Cross: Price
Toyota Hilux
Isuzu D-Max V-Cross
Price (Rs Lakh)
36.69
30.28
Taking top-of-the-line variants into consideration, the Hilux is dearer than the V-Cross by over 6 lakh. For most buyers, that difference is hard to ignore, which is why the D-Max V-Cross comes across as the better value pick. Overall, the V-Cross is a substantial package with a sufficiently powerful diesel engine, 4WD, and a decent feature list. But if you want more power, driving features, safety, a much larger fuel tank, and better screens, then the Hilux is the one to go for. Additionally, Toyota’s bulletproof reliability and widespread service reach are major draws in favour of the Hilux.